Understanding Data Visualization: Techniques for Effective Analysis and Storytelling
Data analysis often involves navigating extensive tables filled with intricate information. Effective visualization can transform these complex datasets into insightful graphics that reveal hidden patterns and relationships. Techniques like linear and bilinear interpolation allow us to derive values and make predictions based on observed relationships. This guide explores best practices for creating graphs, tables, and figures in data analysis. Learn how to present your findings clearly, enhancing the narrative and making your data more accessible and comprehensible.

Understanding Data Visualization: Techniques for Effective Analysis and Storytelling
E N D
Presentation Transcript
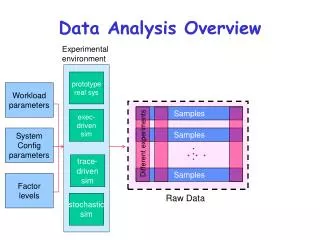
A long, long table… How does one make sense of all this data?
Surface temperature (last Sunday) y x The figure is capable of revealingpatternsthat are not obvious in the data!
Dependence on Time (last Sunday) noon 4:00 pm 9:00 am 5:00 am
It’s evident that… Figures can • Re-tell the data • Reveal patterns • tell a story
Multi-dimensional imaging Consider an enormous data table containing frequencies and the variables x, y, t,andT.
Where do commuter students live (2006)? Residential Commuter
Graphing requirements • Axis labels • Unit designations • Title • Legend • Caption • A story
Graphs in Labs • How did you present your data in the college rankings lab? • How did you present your data in the materials lab? • Why?
When is a table better than a figure? Five significant digits
What’s the density of a 7% mixture? The table shows that the density is 0.98347 g/cm3
Data Analysis: Linear Interpolation What is the density of a 5.5% ethyl alcohol solution at 25 C? Determine by linear interpolation!
Data Analysis: Linear Interpolation To solve, assume a linear relationship between: • Density and temperature and/or • Density and % ethyl alcohol
Data Analysis: Bilinear Interpolation What if there is a non-linear relationship between x and y? y x Over small Δx, can still approximate a linear relationship between x and y.
Data Analysis: Bilinear Interpolation To solve, assume a linear relationship between: • Density and temperature and • Density and % ethyl alcohol 5.5%, T=23C *