Download
1 / 6
60 likes | 191 Vues
The CU Technology Transfer Performance Metrics with a Recent Historical Perspective. July 2006. CU Technology Transfer Over the Past Six Years. Fiscal Year 00-1 01-2 02-3 03-4 04-5 05-6 Invention disclosures 79 121 124 147 177 198 Patent apps filed 46 59 82 100 139 125

E N D
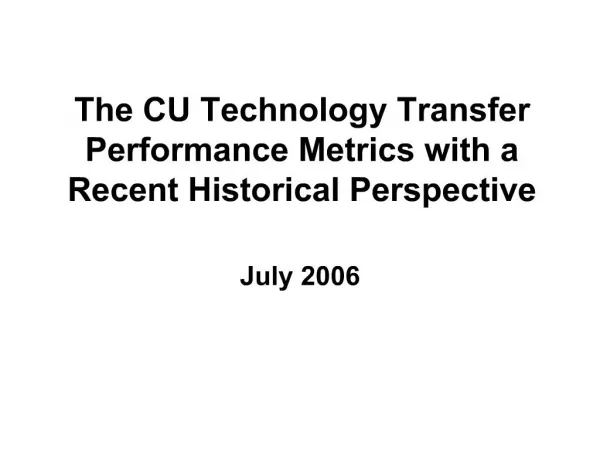
The CU Technology Transfer Performance Metrics with a Recent Historical Perspective July 2006
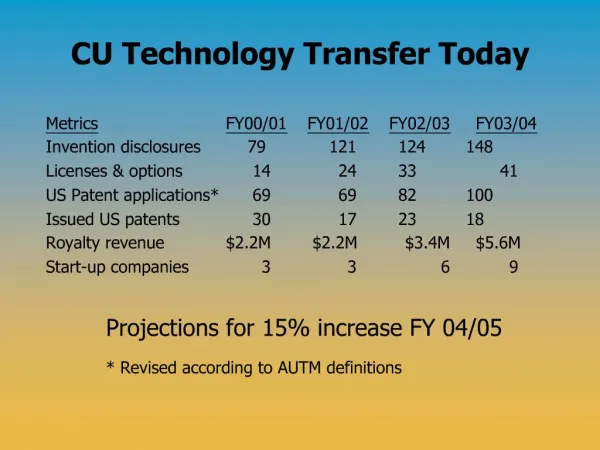
CU Technology Transfer Over the Past Six Years Fiscal Year 00-1 01-2 02-3 03-4 04-5 05-6 Invention disclosures 79 121 124 147 177 198 Patent apps filed 46 59 82 100 139 125 Options and licenses 13 26 34 47 59 57 Revenue in $MM* 2.2 2.1 3.1 5.8 21.7 20.6 Start-up companies 3 3 6 9 9 10 * does not include revenue derived from legal settlements which in FY2003-4 amounted to $28.1M, in FY2004-5 $6.7M and in FY 2005-6 $.7M
Last Five Years of Technology Transfer Transactions by Type Fiscal Year 01-2 02-3 03-4 04-5 05-6 Total Licenses 27 33 41 59 57 and Options Exclusive Licenses 16 13 19 22 36 Non-exclusive 11 20 22 37 21 Licenses Options (included in 6 5 7 11 19 exclusive counts)
Sustainability and Success of Companies Created Based on CU Intellectual Property • In last 13 years, 62 companies formed based on CU IP; 6 known to not be operating “discontinued” • Just in last 3 years 28 companies have been formed, 3 discontinued; of these 3 technologies, one has been re-licensed, one has been optioned and one is being actively developed in a CU lab • Of remaining 56 companies over the 12 year period: • 52 have operations in CO • 10 have received CU TTO POC investments • 4 have gone public • 7 have been acquired by public companies (includes 2 from above) • Using the “but for” criterion, these 52 companies employ 673 people in Colorado
FY 2005-06 Companies Created Based on CU Intellectual Property • indicates a CU Proof of Concept investment recipient
Summary and Implications • For FY 2005-06 compared to previous years: • Appreciable growth in invention disclosures • Higher quality transactions as evident by number of exclusive licenses • Overall for the past five years: • CU’s technology transfer operation has steadily improved, faculty participation has dramatically increased and the overall operation is approaching a mature, consistent flow of intellectual property (IP) and transactions • During this period CU intellectual property has generated almost $90M in revenue that been distributed to inventors, their labs, departments and TTO • TTO is investing back into CU IP through various programs • CU technology transfer has become a growing economic engine for Colorado