Color Image Segmentation
Color Image Segmentation. Advisor : 丁建均 Jian-Jiun Ding Presenter : 蔡佳豪 Chia-Hao Tsai Date: 2011.03.17 Digital Image and Signal Processing Lab Graduate Institute of Communication Engineering National Taiwan University. Outline. Color image segmentation: Rough-set theoretic approach [1]

Color Image Segmentation
E N D
Presentation Transcript
Color Image Segmentation Advisor : 丁建均Jian-Jiun Ding Presenter : 蔡佳豪Chia-Hao Tsai Date: 2011.03.17 Digital Image and Signal Processing Lab Graduate Institute of Communication Engineering National Taiwan University
Outline Color image segmentation: Rough-set theoretic approach [1] Color-Based Image Salient Region Segmentation Using Novel Region Merging Strategy [2] DISP Lab, GICE, NTU
Flowchart DISP Lab, GICE, NTU
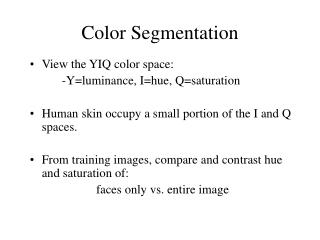
Histon Visualization of color information for the evaluation of similar color regions in an image. The segregation of the elements at the boundary, which can be applied in the process of image segmentation. DISP Lab, GICE, NTU
Histon The histogram of the imageI: For a P×Q neighborhood around a pixel I(m, n), the total distance DISP Lab, GICE, NTU
Histon A matrix X of the size M×N: The histon: DISP Lab, GICE, NTU
Roughness measure The histogram and the histon can be correlated with the concept of approximation space in the rough-set theory. The histogram value can be considered as the lower approximation and the histon value may be considered as the upper approximation. DISP Lab, GICE, NTU
Roughness measure The vector of roughness measure: The value of roughness is large (i.e. close to 1), this situation occurs in the object region where there is very little variation in the pixel intensities. The value of roughness is small (i.e. close to 0), the variation in pixel intensities is near the boundary between the two objects. DISP Lab, GICE, NTU
Flowchart Choose neighborhood (3 × 3) and expanse (100). Select significant peaks and valleys. DISP Lab, GICE, NTU
Thresholding In general, the peaks in the histogram represent the different regions and the valleys represent the boundaries between those regions. The peaks and valleys of the graph of roughness index versus intensity can also be used to segregate different regions in the image. DISP Lab, GICE, NTU
A example (a) Original image, (b) segmented image based on histogram, (c) segmented image based on histon, (d) segmented image based on roughness index. DISP Lab, GICE, NTU
A example 161 249 75 135 254 254 41 72 72 45 44 121 56 56 209 56 210 144 215 (e) histogram of ‘red’ plane with peaks at 45, 72, and 254 and valleys at 56, and 209, (f) histon of ‘red’ plane with peaks at 44, 72, and 254 and valleys at 56, and 210, (g) roughness index of ‘red’ plane with peaks at 41, 75, 135, 161, and 249 and valleys at 56, 121, 144, and 215. DISP Lab, GICE, NTU
How to obtain the significant peaks Criterion1: The height of the peak > (the average value of roughness index for all the pixel intensities) ×1.2. Criterion2: The distance between two peaks > 10. If the peak is satisfied the two criteria, it is significant. DISP Lab, GICE, NTU
How to obtain valleys After the significant peaks are selected, the valleys are obtained by finding the minimum values between every two peaks. DISP Lab, GICE, NTU
Flowchart DISP Lab, GICE, NTU
Region merging Obtaining clusters on the basis of peaks and valleys usually results in over-segmentation. The clusters with pixels less than some predefined threshold are merged with the nearest clusters.(threshold= 0.1% of the total number of pixels in the image) Two closest regions are combined to form a single region based on predefined distance between two clusters.(threshold= 20) DISP Lab, GICE, NTU
Segmentation results DISP Lab, GICE, NTU
Segmentation results DISP Lab, GICE, NTU
Segmentation results • The original image, (b) histogram based approach, (c) histon based approach, (d) roughness index based approach. DISP Lab, GICE, NTU
Segmentation results • The original image, • (b) histogram based approach, • (c) histon based approach, • (d) roughness index based approach. DISP Lab, GICE, NTU
Summarization The number of histogram and histon peaks and valleys is the same and occur more or less at the same pixel intensities. But, in the case of roughness histogram, we observe that we get additional peaks in all the R, G, and B components. Therefore, roughness index based approach achieves better segmentation results. DISP Lab, GICE, NTU
Color-Based Image Salient Region Segmentation Using Novel Region Merging Strategy [2]
Introduction The main purpose of this paper is not to precisely segment every single object in an image but to find the salient regions that are relatively meaningful to human perception. For salient image segmentation, the salience is a macro property of an image. In other words, a salient region can be easily identified when we see an image. DISP Lab, GICE, NTU
The examples for salient regions The dog and the grass are salient regions. The herd of elephants is a salient region. DISP Lab, GICE, NTU
Flowchart • Dominant color extraction. • Region merging based on merging likelihood. • Region merging based on color similarity. DISP Lab, GICE, NTU
The first phase: Dominant color extraction Develop a new dominant color-extraction scheme based on nonparametric density estimation. Given an n-dimensional dataset the nonparametric density f(x) where denotes unimodal density kernel and σ is the bandwidth for the kernel. DISP Lab, GICE, NTU
The first phase: Dominant color extraction Decompose the 3-D color space into three 1-D feature spaces, the nonparametric density is reformulated as where h(r) denotes the histogram of an image for one of the three color channels, rk is the kth level of that channel and M is the total number of levels of it (In general, M=256). DISP Lab, GICE, NTU
The first phase: Dominant color extraction After nonparametric estimation density, using the gradient ascent scheme we can easily find the local maxima. We select the local maxima of each channel and combine them to form the candidates of dominant colors. DISP Lab, GICE, NTU
The first phase: Dominant color extraction • Original densities. • Nonparametric densities. • Color combinations. DISP Lab, GICE, NTU
The first phase: Dominant color extraction y=67, u=123, v=151 (dominant color) A color y=25, u=220, v=148 DISP Lab, GICE, NTU
The first phase: Dominant color extraction After the pixel assignments, each pixel in image has been replaced by the nearest candidate. Consequently, a quantized color image is obtained and a label map is created as well. DISP Lab, GICE, NTU
Flowchart • Dominant color extraction. • Region merging based on merging likelihood. • Region merging based on color similarity. DISP Lab, GICE, NTU
The second phase : Region merging based on merging likelihood Apply the region-growing algorithm on the label map of the quantized image to obtain initial regions. Some of them may be very small and less important. Therefore, not all initial regions are salient. In the following, we will define the salience of image region, and calculate the region importance. DISP Lab, GICE, NTU
The second phase : Region merging based on merging likelihood Apply the region-growing algorithm on the label map of the quantized image to obtain initial regions. Some of them may be very small and less important. Therefore, not all initial regions are salient. In the following, we will define the salience of image region, calculate the region importance. DISP Lab, GICE, NTU
What are the salient regions? Salient regions should be conspicuous. Salient regions should be compact and complete. DISP Lab, GICE, NTU
The second phase : Region merging based on Importance index and Merging likelihood Importance index: is used to measure the importance of a region. Merging likelihood: is utilized to measure the suitability of region merging. Whether a region should be merged mainly depends on its “Importance index”, and where it should be merged into depends on the “Merging likelihood” between the region and each of its adjacent regions. DISP Lab, GICE, NTU
The second phase : Region merging based on Importance index and Merging likelihood Importance index: DISP Lab, GICE, NTU
Flowchart • Dominant color extraction. • Region merging based on merging likelihood. • Region merging based on color similarity. DISP Lab, GICE, NTU
The second phase : Region merging based on Importance index and Merging likelihood • Merging likelihood: • Color distance between regions. • Boundary length between regions. • Region sizes of neighboring regions. DISP Lab, GICE, NTU
The second phase : Region merging based on Importance index and Merging likelihood From the definition above, we can easily find that a region with a smaller color distance, longer boundary length, and smaller region size will produce a higher value of merging likelihood. DISP Lab, GICE, NTU
Flowchart • Dominant color extraction. • Region merging based on merging likelihood. • Region merging based on color similarity. DISP Lab, GICE, NTU
The third phase: Region merging based on color similarity If the color distance between two connected important regions is less than Ts, they are similar and should be merged. DISP Lab, GICE, NTU
Segmentation results (a) Source image (b)Quantized image. (c) Initial regions. (d) Surviving regions represented in mean colors with region number. (e) Result (after further-merging) represented in mean colors. (f) Final Segmentation result. DISP Lab, GICE, NTU
Segmentation results • Source images. • Quantized images. • Segmentation results represented in mean colors. • Segmentation results. DISP Lab, GICE, NTU
Segmentation results • Source images. • Quantized images. • Segmentation results represented in mean colors. • Segmentation results. Typical failure cases! DISP Lab, GICE, NTU
Summarization Unlike the object segmentation, salient region segmentation is not necessary to extract each object in an image accurately but viewing the whole objects as a salient region. Salient region segmentation is more feasible for applications such as region based image/video retrieval than is the object segmentation. DISP Lab, GICE, NTU
References [1] Mushrif, M.M., A.K. Ray, “Color Image Segmentation: Rough-Set Theoretic Approach,” Pattern Recognition Letters, vol. 29, issue 4, pp. 483–493, March 2008. [2] Y. H. Kuan, C. M. Kuo, and N. C. Yang, “Color-based image salient region segmentation using novel region merging strategy,” IEEE Trans. Multimedia, vol. 10, no. 5, pp. 832–845, Aug. 2008. [3] R. C. Gonzalez, and R. E. Woods, "Chapter 10: Image Segmentation," Digital Image Processing 3rd Ed., pp.738-763, Prentice-Hall, 2008. [4] S. Arora, J. Acharya, A. Verma, and Prasanta K. Panigrahi, "Multilevel thresholding for image segmentation through a fast statistical recursive algorithm," Pattern Recognition Letters, vol. 29, Issue 2, pp. 119-125, Jan. 2008. [5] F. Yan, H. Zhang, and C. R. Kubeb, "A multistage adaptive thresholding method," Pattern Recognition Letters, vol. 26, Issue 8, pp. 1183-1191, June 2005. DISP Lab, GICE, NTU