Modified SIR for Vector-Borne Diseases
Modified SIR for Vector-Borne Diseases. Katherine Kamis & Jacob Savos. Aims and Objectives. To create a universal modified SIR model for vector-borne diseases to make predictions of the spread of these diseases . Introduction.


Modified SIR for Vector-Borne Diseases
E N D
Presentation Transcript
Modified SIR for Vector-Borne Diseases Katherine Kamis & Jacob Savos
Aims and Objectives • To create a universal modified SIR model for vector-borne diseases to make predictions of the spread of these diseases
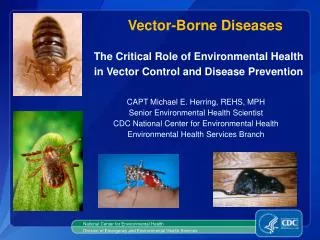
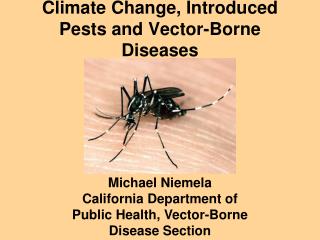
Introduction • A Vector-borne disease is transmitted by a pathogenic microorganism from an infected host to another organism • We will be creating a model using a tick-borne disease
Literature Review - Ticks • Ticks have a two-year life cycle • Ticks acquire a vector-borne disease by feeding on an infected host • Once infected, ticks transmit the disease by feeding on an uninfected host http://www.womenhunters.com/ticks-kim-roberts.html Lone Star Tick http://www.ent.iastate.edu/imagegal/ticks/iscap/all4.html Deer Tick http://www.aldf.com/deerTickEcology.shtml
Literature Review - SIR • Susceptible • Infected • Recovered Susceptible Infected Recovered
Rates of Change • Tangent line – slope at a certain point • Tangent lines are estimates of the rates of change • Rates of change can be used to estimate actual points • S(t + h) = S(t) + S’(t)*h • S(0 + 1)=S(0)+S’(0)*1 http://www.clas.ucsb.edu/staff/lee/secant,%20tangent,%20and%20derivatives.htm http://www.flatworldknowledge.com/node/30962#web-30962
SIR - Equations The rate of change of the susceptible = The product of the susceptible and infected times the opposite of the transmittal constant k = Transmittal constant S(1) = B9 + (-$B$4 * B9 * C9)
SIR - Equations • k = Transmittal constant • c = Recovery rate The rate of change of infected = The product of the susceptible, infected, and transmittal constant subtracted by the product of the recovery rate and the infected population I(1) = C9 + ($B$4*C9*B9)-($B$3*C9)
SIR - Equations The rate of change of recovered = The product of the recovery rate and the infected population c = Recovery rate R(1) = D9 + ($B$3 * F9)
Vector-borne model Birth Death Death Hosts Susceptible Infected Vectors Infected Susceptible Death Death Birth
Gaff Modified SIR Model Rate of Change of the Host Population B – Birth rate of hosts b – Death rate of hosts K – Carrying capacity for hosts per m2 N – Host population
Gaff Modified SIR Model Rate of Change of Tick Population V – Tick population B’ – Birth rate of ticks b’ – Death rate of ticks M – Maximum number of ticks per host N – Host population
Gaff Modified SIR Model Rate of change of the Infected Host Population Y – Infected host population A – Transmission rate from ticks to hosts N – Host population (total) X – Infected tick population B – Birth rate for ticks K – Carrying capacity for hosts per m2 b – Death rate of hosts v – Recovery rate of hosts
Gaff Modified SIR Model Rate of change of the infected tick population X – Infected tick population A’ – Transmission rate for hosts to ticks Y – Infected host population N – Host population (total) V – Tick population (total) X – Infected tick population B’ – Tick birth rate M – Maximum number of ticks per host b’ – Tick death rate
Excel Single Patch Model Change in Infected Host = $C$10*((B15-E15)/B15)*F15-$C$2*((B15*E15)/$C$4)-($C$7+$C$12)*E15 Change in Infected Ticks = $C$11*(E15/B15)*(C15-F15) - ($C$3*((C15*F15)/($C$6*B15))) - $C$8*F15 Change in Tick Population = $C$3*C15*((($C$6*B15)-C15)/($C$6*B15)-($C$8*C15) Change in Host Population = $C$2*(($C$4-B15)/$C$4)*B15 - $C$7*B15
Multi-Patch Model Excel Multi-Patch Model
Methodology • Begin with a simple SIR model • Develop variables needed to modify the model • Attempt to modify the model to incorporate all vector-borne diseases
Bibliography Academy of Science. Academy of Science Mathematics BC Calculus Text. Breish, N., & Thorne, B. (n.d.). Lyme disease and the deer tick in maryland. Maryland: The University of Maryland. Gaff, H. D., & Gross, L. J. (2006). Modeling Tick-Borne Disease: A Metapopulation Model. Mathematical Biology , 69, 265-288. Neuwirth, E., & Arganbright, D. (2004). The active modeler: mathematical modeling with Microsoft Excel. Belmont, CA: Thomson/Brooks/Cole. Stafford III, K. (2001). Ticks. New Haven: The Connecticut Agricultural Experiment Station.