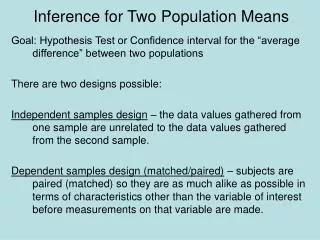
6.3 One and Two-Sample Inference for Means
100 likes | 279 Vues
6.3 One and Two-Sample Inference for Means. Example. JL Kim did some crude tensile strength testing on pieces of some nominally .012 in diameter wire of various lengths. The lengths are given in the data file WIRE in the class directory.

6.3 One and Two-Sample Inference for Means
E N D
Presentation Transcript
Example JL Kim did some crude tensile strength testing on pieces of some nominally .012 in diameter wire of various lengths. The lengths are given in the data file WIRE in the class directory. • If one is to make a confidence interval for the mean measured strength of 25 pieces of this wire, what model assumption must be employed? Make a plot useful in assessing the reasonableness of this assumption. • Make a 95% two-sided confidence interval for the mean measured strength of the 25cm pieces of this wire. • Is there sufficient evidence to suggest that the diameter differs from nominal?
Overview • Previously we have discussed ways of making inferential statements concerning a population mean when the population standard deviation is known and the sample size is large • Actually, one will rarely know what the true population standard deviation is and will have to approximate the population standard deviation using the collected sample • Furthermore, one will not always be able to collect a large sample due to various physical constraints • If n is large, then use the previous methods
Small Sample Inference for µ • (Student) t distribution should be used • Table B.4 on page 790 gives Quantiles • Degrees of freedom = ν = “nu”= n-1 • Probability densities of t are bell-shaped and symmetric about zero • Flatter than standard normal density but are increasingly like it as ν gets larger • For ν >30, t and z distributions are almost indistinguishable
Example • Part of a data set of W. Armstrong gives numbers of cycles to failure of 10 springs of a particular type under a stress of 950 N/mm2. These spring-life observations are given below in units of 1,000 cycles. • 225,171,198,189,189,135,162,135,117,162 • What is the average spring lifetime under these conditions?
Minitab Output • Descriptive Statistics: lieftime • Variable N Mean StDev SE Mean • lieftime 10 168.3 33.1 10.5
Example – part B • An investigator claims that the lifetime is less than 190,000 cycles. Test his claim at α = .05.
Example 2 • A cereal company claims that the mean weight of cereal in a “16-ounce box” is at least 16.15 ounces. As a means of testing the company’s claim, a consumer advocacy group randomly samples 10 boxes and obtains an average weight of 16.06 ounces and a standard deviation of .10 oz. Conduct the appropriate hypothesis test using a significance level of 0.05.