6.3 Two-Sample Inference for Means
6.3 Two-Sample Inference for Means. November 17, 2003. Paired Differences. Matched Pairs Design experimental plan where the experimental units are divided into halves and two treatments are randomly assigned to the halves

6.3 Two-Sample Inference for Means
E N D
Presentation Transcript
6.3 Two-Sample Inference for Means November 17, 2003
Paired Differences • Matched Pairs Design • experimental plan where the experimental units are divided into halves and two treatments are randomly assigned to the halves • Attempting to determine if there is a significant difference between the mean responses of the treatments
Procedure • Obtain the difference between responses for each experimental unit • Analyze the differences using a one-sample approach • If a large sample is obtained, use critical values from the Standard Normal distribution (z) • Otherwise, use critical values from the corresponding t distribution
Example 9 pg 370 • Students worked with a company on the monitoring of the operation of an end-cut router in the manufacture of a wood product. They measured the critical dimensions of a number of pieces of a type as they came off the router. Both a leading-edge and a trailing-edge measurement were made on each piece. Both were to have a target value of .172 in.
Hypothesis Test • Is there a significant difference between the measurements at α =.01? • Ho: µ = 0 • Ha: µ ≠ 0
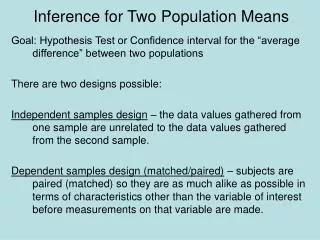
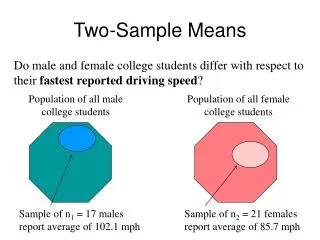
Independent Samples • The goal of this type of inference is to compare the mean response of two variables (or treatments) when the data are not paired or matched • A key assumption that will be made is that the separate samples used to collect information concerning the two variables are independent • One sample does not influence the other sample in any way • Furthermore, one must assume that both sampled populations are normally distributed
Large Sample Comparison • The quantity of interest is a linear combination of population means, namely µ1 - µ2 • The above quantity will be estimated by • As a result, various quantities of the sampling distribution of the difference, under the assumption of equality between the means, need to be developed • Ho: µ1 - µ2 = # • Ha: µ1 - µ2 ≠ #
Example • A company research effort involved finding a workable geometry for molded pieces of a solid. A comparison was made between the weight of molded pieces and the weight of irregularly shaped pieces that could be poured into the same container. A series of 30 attempts to pack both the molded and the irregular pieces of the solid were compared. Is there enough evidence to suggest that the irregular pieces produced higher weights?
1 = molded n1 = 30 s1= 9.31 = 164.65 2=irregular n2 = 30 s2= 8.51 = 179.65 The Data
Small Samples • If at least one sample size is small, then use critical values from a t distribution for constructing confidence intervals and performing hypothesis tests with degrees of freedom obtained by Satterthwaite’s Approximation
Example • The data shown gives spring lifetimes under two different levels of stress (900 and 950 N/mm2). Do the data give evidence of a significant difference at α = .05?
Minitab Output Descriptive Statistics: 950, 900 Variable N Mean Median TrMean StDev SE Mean 950 10 168.3 166.5 167.6 33.1 10.5 900 10 215.1 216.0 211.5 42.9 13.6
Assignment • Page 385: #3, #4