Analyzing Gender Differences in Average Fastest Reported Driving Speed among College Students
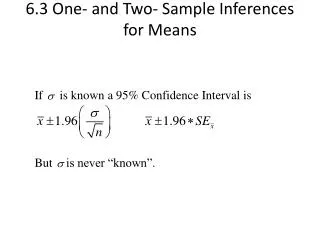
This study investigates whether male and female college students differ in their fastest reported driving speeds. A sample of 17 male students reported an average speed of 102.1 mph, while 21 female students reported an average of 85.7 mph. We set up null and alternative hypotheses regarding the population means and determined the p-value to assess the significance of the differences. With a p-value of 0.001, we reject the null hypothesis and conclude that there is substantial evidence showing that average driving speeds differ by gender.

Analyzing Gender Differences in Average Fastest Reported Driving Speed among College Students
E N D
Presentation Transcript
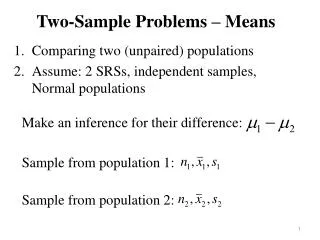
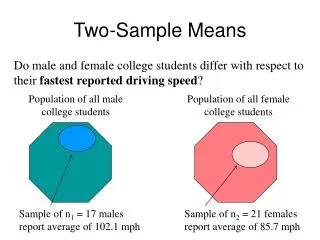
Two-Sample Means Do male and female college students differ with respect to their fastest reported driving speed? Population of all male college students Population of all female college students Sample of n1 = 17 males report average of 102.1 mph Sample of n2 = 21 females report average of 85.7 mph
The Question in Statistical Notation Let M = the average fastest speed of all male students. and F = the average fastest speed of all female students. Then we want to know whether MF. This is equivalent to knowing whether M -F 0
Set up hypotheses • Null hypothesis: • H0: M = F [equivalent to M - F = 0] • Alternative hypothesis: • Ha: M F [equivalent to M - F 0]
Make initial assumption • Assume null hypothesis is true. • That is, assume M = F • Or, equivalently, assume M - F = 0
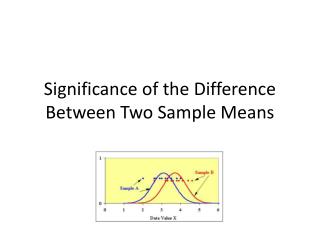
Determine the P-value • P-value = “How likely is it that our sample means would differ by as much as 16.35 m.p.h. if the difference in population means really is 0?” • The P-value, 0.001, is small. Our sample result is not likely if the null hypothesis is true. • Reject the null hypothesis.
How the P-value is calculated The P-value is determined by standardizing, that is, by calculating the two-sample test statistic... …and comparing the value of the test statistic to the appropriate sampling distribution. The sampling distribution depends on how you estimate the standard error of the differences.
If variances of the measurements of the two groups are equal... Estimate the standard error of the difference using the common pooled variance: where Then the sampling distribution is a t distribution with n1+n2-2 degrees of freedom. Assume variances are equal only if neither sample standard deviation is more than twice that of the other sample standard deviation.
If variances of the measurements of the two groups are notequal... Estimate the standard error of the difference as: Then the sampling distribution is an approximate t distribution with a complicated formula for d.f.
Make a decision • There is sufficient evidence, at the 0.05 level of significance, to conclude that the average reported fastest driving speed of all male college students differs from the average reported fastest driving speed of all female students.