Measurements:
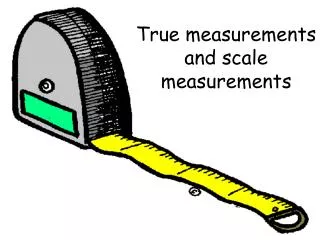
Measurements:. Every measurement has UNITS. Every measurement has UNCERTAINTY. Accuracy and Precision in Measurements. Accuracy: how close a measurement is to the accepted value. Precision: how close a series of measurements are to one another or how far out a measurement is taken.

Measurements:
E N D
Presentation Transcript
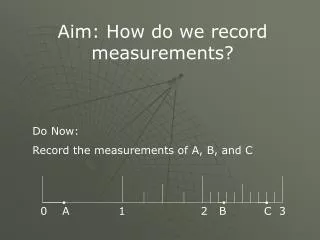
Measurements: Every measurement has UNITS. Every measurement has UNCERTAINTY.
Accuracy and Precision in Measurements Accuracy: how close a measurement is to the accepted value. Precision: how close a series of measurements are to one another or how far out a measurement is taken. A measurement can have high precision, but not be as accurate as a less precise one.
Precision can also mean • The number of decimal places assigned to the measured number (The more decimal places, the more precise the measurement) • Ex. • 2.1 cm • 2.10 cm • 2.100 cm
Significant Figures are used to indicate the precision of a measured number or to express the precision of a calculation with measured numbers. In any measurement the digit farthest to the right is considered to be estimated. 0 1 2 2.0 1.3
Sig. Fig. Rules (with measurements): 1. All non-zero digits are significant. • 3 sig figs • 1222 4 sig figs • 0.54 2 sig figs 2. Zeros at the beginning of a measurement are not significant. 0.005 1 sig fig 0.0015 2 sig figs 0.00000887 3 sig figs
3. Zeros in between two significant figures are significant 0.00505 3 sig figs 40065 5 sig figs 4. Final zeros after a decimal point are significant 1.0 2 sig figs 74.00 4 sig figs 105.20 5 sig figs 0.0050 2sig figs 2.000 4 sig figs 20.0 3 sig figs Counted numbers and definitions (2.54 cm = 1 inch) are considered to be exact and have no effect on the number of sig. figs. reported in calculations with measurements.
Calculations with sig. Figs. Addition and subtraction: Look at decimal places! Answer should have the same amount of decimal places as the measurement with the least amount 3.63 cm 13.129 cm +123.1 cm 139.859 cm = 139.9 cm significant to the 0.1 place
Measurement Calculations with scientific notation. Addition/subtraction: must be placed into the same notation. (2.3 x 10³) + (3.2 x 10⁴) = 0.23 x 10⁴ +3.2 x 10⁴ 3.43 x 104 = 3.4 x 10⁴
Calculations with Sig. figs. Multiplication and division (measurements): Count sig figs!! Answer should have the same amount of sig figs as the measurement with the least amount. 2.734 cm x 5.2 cm x 8.1294 cm = 115.5740539 cm3 4 s.f. 2 s.f. 5 s.f. written as 120 cm3 2 s.f.’s
1. The term that is related to the reproducibility (repeatability) of a measurement is a. accuracy. b. precision. c. qualitative. d. quantitative. e. property. Let’s take a “Quiz” b. precision. 2. The number of significant figures in the mass measured as 0.010210 g is a. 1. b. 2. c. 3. d. 4. e. 5. e. 5.
3. The number of significant figures in 6.0700 x 10⁻⁴… is a. 3. b. 4. c. 5. d. 6. e. 7. c. 5. 4. How many significant figures are there in the value 0.003060? a. 7 b. 6 c. 5 d. 4 e. 3 d. 4
your value accepted value Percent Error • Indicates accuracy of a measurement
% error = 2.9 % Percent Error • A student determines the density of a substance to be 1.40 g/mL. Find the % error if the accepted value of the density is 1.36 g/mL.