Network Traffic Monitoring with Wireshark
630 likes | 664 Vues
Learn how to use Wireshark, a packet sniffer and protocol analyzer, to monitor and analyze network traffic for network management, security, and troubleshooting purposes.

Network Traffic Monitoring with Wireshark
E N D
Presentation Transcript
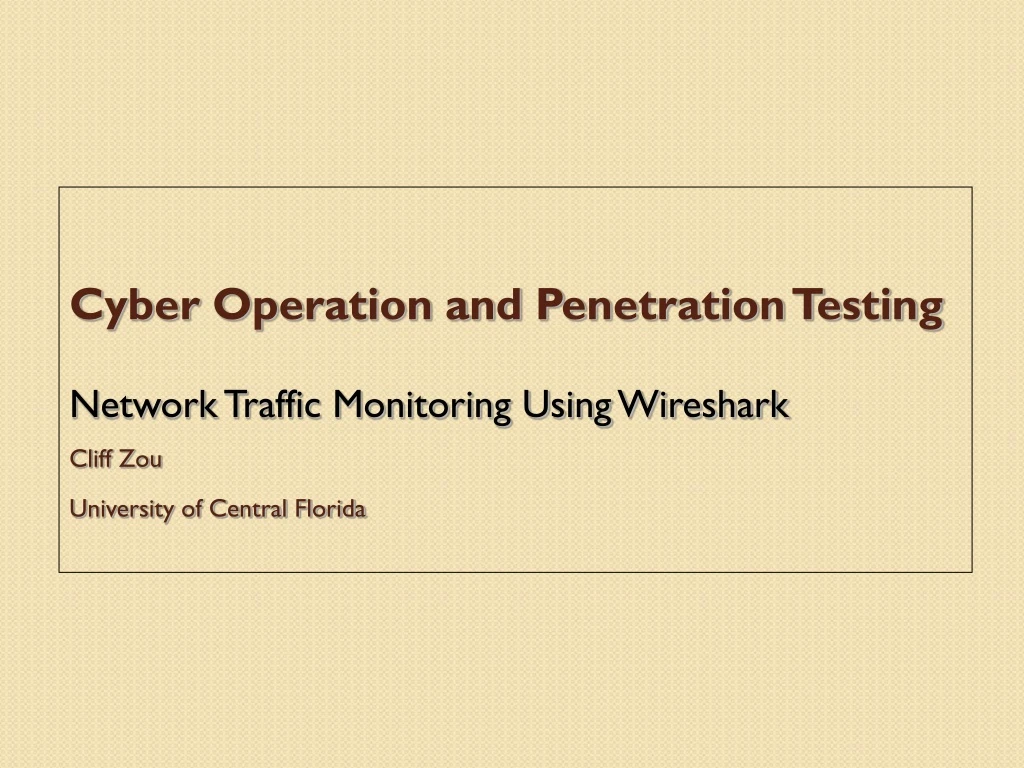
Cyber Operation and Penetration TestingNetwork Traffic Monitoring Using WiresharkCliff ZouUniversity of Central Florida
Acknowledgement • http://ilta.ebiz.uapps.net/ProductFiles/productfiles/672/wireshark.ppt • UC Berkley course “EE 122: Intro to Communication Networks” • http://www.eecs.berkeley.edu/~jortiz/courses/ee122/presentations/Wireshark.ppt • Other resources: • http://openmaniak.com/wireshark_filters.php
Motivation for Network Monitoring • Essential for Network Management • Router and Firewall policy • Detecting abnormal/error in networking • Access control • Security Management • Detecting abnormal traffic • Traffic log for future forensic analysis
Tools Overview • Tcpdump • Unix-based command-line tool used to intercept packets • Including filtering to just the packets of interest • Reads “live traffic” from interface specified using -i option … • … or from a previously recorded trace file specified using -r option • You create these when capturing live traffic using -w option • Tshark • Tcpdump-like capture program that comes w/ Wireshark • Very similar behavior & flags to tcpdump • Wireshark • GUI for displaying tcpdump/tshark packet traces
Tcpdump example • Ran tcpdump on a Unix machine • First few lines of the output: 01:46:28.808262 IP danjo.CS.Berkeley.EDU.ssh > adsl-69-228-230-7.dsl.pltn13.pacbell.net.2481: . 2513546054:2513547434(1380) ack 1268355216 win 12816 01:46:28.808271 IP danjo.CS.Berkeley.EDU.ssh > adsl-69-228-230-7.dsl.pltn13.pacbell.net.2481: P 1380:2128(748) ack 1 win 12816 01:46:28.808276 IP danjo.CS.Berkeley.EDU.ssh > adsl-69-228-230-7.dsl.pltn13.pacbell.net.2481: . 2128:3508(1380) ack 1 win 12816 01:46:28.890021 IP adsl-69-228-230-7.dsl.pltn13.pacbell.net.2481 > danjo.CS.Berkeley.EDU.ssh: P 1:49(48) ack 1380 win 16560
This is an IP packet Source host name Destination port number Destination host name TCP specific information What does a line convey? 01:46:28.808262 IP danjo.CS.Berkeley.EDU.ssh > adsl-69-228-230-7.dsl.pltn13.pacbell.net.2481: . 2513546054:2513547434(1380) ack 1268355216 win 12816 Timestamp Source port number (22) • Different output formats for different packet types
Similar Output from Tshark 1190003744.940437 61.184.241.230 -> 128.32.48.169 SSH Encrypted request packet len=48 1190003744.940916 128.32.48.169 -> 61.184.241.230 SSH Encrypted response packet len=48 1190003744.955764 61.184.241.230 -> 128.32.48.169 TCP 6943 > ssh [ACK] Seq=48 Ack=48 Win=65514 Len=0 TSV=445871583 TSER=632535493 1190003745.035678 61.184.241.230 -> 128.32.48.169 SSH Encrypted request packet len=48 1190003745.036004 128.32.48.169 -> 61.184.241.230 SSH Encrypted response packet len=48 1190003745.050970 61.184.241.230 -> 128.32.48.169 TCP 6943 > ssh [ACK] Seq=96 Ack=96 Win=65514 Len=0 TSV=445871583 TSER=632535502
Demo 1 – Basic Run • Syntax: tcpdump [options] [filter expression] • Unfortunately, Eustis machine does not allow normal users to run tcpdump • $ sudo tcpdump –i eth0 • Sudo command allows you to run tcpdump in root previlege • On your own Unix machine, you can run it using “sudo” or directly run “tcpdump” if you have root previliege • Observe the output
Filters • We are often not interested in all packets flowing through the network • Use filters to capture only packets of interest to us
Demo 2 • Capture only udp packets • tcpdump “udp” • Capture only tcp packets • tcpdump “tcp”
Demo 2 (contd.) • Capture only UDP packets with destination port 53 (DNS requests) • tcpdump “udp dst port 53” • Capture only UDP packets with source port 53 (DNS replies) • tcpdump “udp src port 53” • Capture only UDP packets with source or destination port 53 (DNS requests and replies) • tcpdump “udp port 53”
Demo 2 (contd.) • Capture only packets destined to longwood.eecs.ucf.edu • tcpdump “dst host longwood.eecs.ucf.edu” • Capture both DNS packets and TCP packets to/from longwood.eecs.ucf.edu • tcpdump “(tcp and host longwood.eecs.ucf.edu) or udp port 53”
How to write filters • Refer the tcpdump/tshark man page • Many example webpages on the Internet
Running tcpdump • Requires superuser/administrator privileges on Unix • http://www.tcpdump.org/ • You can do it on your own Unix machine • You can install a Linux OS in Vmware on your windows machine • Tcpdump for Windows • WinDump: http://www.winpcap.org/windump/ • Free software
So What is WireShark? • Packet sniffer/protocol analyzer • Open Source Network Tool • Latest version of the ethereal tool
What is tShark? • The command-line based packet capture tool • Equivalent to Wireshark
Network Layered Structure • What is the Internet? Web, Email, VOIP Application Application TCP, UDP Transport Transport IP Network Network Ethernet, cellular Data Link Data Link Physical link
Capture Options • Promiscuous mode is used to • Capture all traffic • Sometime this does not work: • driver does not support • You are on a switch LAN
Capture Filter examples host 10.1.11.24 host 192.168.0.1 and host 10.1.11.1 tcp port http ip not broadcast not multicast ether host 00:04:13:00:09:a3
Display Filters (Post-Filters) • Display filters (also called post-filters) only filter the view of what you are seeing. All packets in the capture still exist in the trace • Display filters use their own format and are much more powerful then capture filters
Display Filter Examples ip.src==10.1.11.00/24 ip.addr==192.168.1.10 && ip.addr==192.168.1.20 tcp.port==80 || tcp.port==3389 !(ip.addr==192.168.1.10 && ip.addr==192.168.1.20) (ip.addr==192.168.1.10 && ip.addr==192.168.1.20) && (tcp.port==445 || tcp.port==139) (ip.addr==192.168.1.10 && ip.addr==192.168.1.20) && (udp.port==67 || udp.port==68) tcp.dstport == 80
32 bits source port # dest port # sequence number acknowledgement number head len not used Receive window U A P R S F checksum Urg data pnter Options (variable length) application data (variable length) TCP segment structure URG: urgent data (generally not used) counting by bytes of data (not segments!) ACK: ACK # valid # bytes rcvr willing to accept PSH: push data now RST, SYN, FIN: connection estab (setup, teardown commands) Internet checksum (as in UDP)
Display Filter • String1, String2 (Optional settings): • Sub protocol categories inside the protocol. • Look for a protocol and then click on the "+" character. • Example: • tcp.srcport == 80 • tcp.flags == 2 • SYN packet • Tcp.flags.syn==1 • tcp.flags == 18 • SYN/ACK • Note of TCP Flag field:
Display Filter Expressions • snmp || dns || icmp • Display the SNMP or DNS or ICMP traffics. • tcp.port == 25 • Display packets with TCP source or destination port 25. • tcp.flags • Display packets having a TCP flags • tcp.flags.syn == 0x02 • Display packets with a TCP SYN flag. If the filter syntax is correct, it will be highlighted in green, otherwise if there is a syntax mistake it will be highlighted in red. Correct syntax Wrong syntax
Save Filtered Packets After Using Display Filter • We can also save all filtered packets in text file for further analysis • Operation: FileExport packet dissections as “plain text” file 1). In “packet range” option, select “Displayed” 2). In choose “summary line” or “detail”
Follow TCP Stream • red - stuff you sent blue - stuff you get
Filter out/in Single TCP Stream • When click “filter out this TCP stream” in previous page’s box, new filter string will contain like: • http and !(tcp.stream eq 5) • So, if you use “tcp.stream eq 5” as filter string, you keep this HTTP session
Use the “Copy” button to copy all text into clipboard • Then, you can analyze this text file to get what statistics you want
Find EndPoint Statistics • Menu “statistics” “endpoint list” “TCP” • You can sort by field • “Tx” : transmit “Rx” : receive
Find EndPoint Statistics • Use the “Copy” button to copy all text into clipboard • Then, you can analyze this text file to get what statistics you want