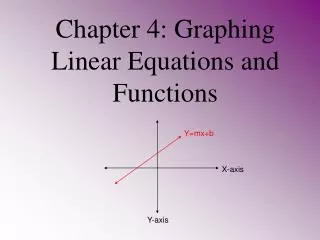
Linear Equations and Functions
Linear Equations and Functions. Chapter 2 Mr. Hardy. DO NOW. Complete the Personal Identity Worksheet- ANONYMOUSLY Take out the Chapter 1.4 Practice B Assignment. DO NOW. Skill Review on Page 66 in the textbook!. Journal Topics.

Linear Equations and Functions
E N D
Presentation Transcript
Linear Equations and Functions Chapter 2 Mr. Hardy
DO NOW • Complete the Personal Identity Worksheet- ANONYMOUSLY • Take out the Chapter 1.4 Practice B Assignment
DO NOW • Skill Review on Page 66 in the textbook!
Journal Topics • If 1/3 of a number is 2 more than 1/5 of the number, then what is an equation that can be used to find the number x? • If a six-sided polygon has 2 sides of length x – 2y each and 4 sides of length 2x + y, what is its perimeter?
ACT Practice • A book contains 10 photographs, some in color and some in black-and-white. Each of the following could be the ratio of color to black-and-white photographs EXCEPT: • A) 9:1 • B) 4:1 • C) 5:2 • D) 3:2 • E) 1:1
Chapter 2 Intro • Topics • Functions and their Graphs • Slope and Rate of Change • Quick Graphs of Linear Equations • Writing Equations of Lines • Correlation and Best-Fitting Lines • Linear Inequalities and Two Variables • Absolute Value Functions
Relations vs Functions • A relation is a mapping, or pairing, of input values with output values. Simply, it is any ordered pair that shows a relationship between an input and output value • Domain – input values • Range – output values • (D, R) • A relation is a FUNCTION provided there is exactly one output for each input (one x-value yields one and only one y-value)
Domain and Range • Find the Domain and Range of the ordered pairs • (0, 9.1) • (10, 6.7) • (20, 10.7) • (30, 13.2) • (34, 15.5)
Functions in Context • What is the domain and range? • Based on what we know, could this chart represent a function?
Take a Better Look This IS NOT a Function This IS a Function
More Examples This IS a Function This IS a Function
Observe the Following Number Sets THIS IS A FUNCTION THIS IS NOT A FUNCTION
Relations Using Ordered Pairs • Ordered Pairs come in the form of (x, y) • Ordered Pairs can be plotted as points on a coordinate plane • Describe the x and y values in each quadrant
Vertical Line Test • The vertical line test is a trick used to determine whether or not a graph represents a function • Simply draw a vertical line down the graph. If it goes through more than one (two or more) points on the graph, it does NOT represent a function
Vertical Line Test BY THE VERTICAL LINE TEST, THIS IS NOT A FUNCTION
Graphing a Function • Graph the Function y = ½ x + 1 (linear function) or in function notation f(x) = ½x + 1 • We can begin by constructing a table • Plot the Points • Draw a line
Example Evaluating f(x) • F(x)= 2x + 1 • 2 (0) + 1 = 1 (0, 1) • 2 (1) + 1 = 3 (1, 3) • 2 (2) + 1 = 5 (2, 5) • 2 (6) + 1 = 13 (6, 13) • Every input will result in one output; therefore, this is a function
Evaluating F(x) • F(x) = √x • √1 = ±1 • √4 = ±2 • √9 = ±3 • √100 = ±10 • √144 = ±12 • Every input will result in two outputs (± the squares); consequently, this is NOT a function!!!!!!!
Linear Functions • y = mx + b • Function notation • f(x) = mx + b • The symbol f(x) is read as “f of x,” meaning the value of the function at x. • This is another name for y! • Think in terms of independent and dependent variables.
GO TO THE BOARD • Draw or write an example of a function and an example that is NOT a function. • A table • A map • Coordinates • Or Graph
Wrapping Up • Is a function always a relation? Is a relation always a function? Explain your reasoning • Homework: Chapters 2.1 Numbers 20 - 42 even, 49 and 50, and 53 - 58 all. • Read chapter 2.2 and take notes!!!
DO NOW: Homework Quiz • Chapter 1 Review (pg 58 – 60) • 6, 15, 18, 22, 32 • Section 2.1 (71 – 73) • 30 • ANSWERS/GRAPHS ONLY
Recall • Solve the equation • -⅓(x – 15) = -48 • 6x + 5 = 0.5(x + 6) – 4 • Simplify, when x = 6, and y = 4
Evaluate the Function • Evaluate f(x) = -3x2 – 2x + 8 • when x = -2 • Evaluate f(5) = -½x - 9
Introduction • Complete the Chart and Analyze a trend or pattern based on gas prices. Graph the ordered pairs if necessary
WHAT DID YOU NOTICE? • Graph the ordered pairs- Label the axes. • What does the horizontal axis represent? • What does the vertical axis represent?
WHAT ELSE DID YOU NOTICE? • What is the pattern that you noticed? • What is the ratio of the vertical change to the horizontal change? Simplified. • What does this represent? • Does it remain constant based on the gas prices? • Check other ratios to find out.
Slope A line has a positive slope if it is going uphill (increasing) from left to right. A line has a negative slope if it is going downhill (decreasing) from left to right.
Slope • The steepness of a line that compares the RATE of CHANGE (The change in y per unit x). The larger the slope the steeper the line • Random information: • Slope is usually denoted by • The m comes from the French verb monter, meaning “to rise” or “to ascend.”
Classification of Slope • A line with a positive slope rises (increases) from left to right (m > 0). • A line with a negative slope falls (decreases) from left to right (m < 0). • A line with a slope of zero is horizontal (m = 0) or y = b • A line with an undefined slope is vertical (m is undefined) or x = a
Parallel and Perpendicular Lines • Parallel lines do not intersect, and have the same slope • Perpendicular lines intersect, and form a right angle. The lines are perpendicular if AND ONLY if their slopes are negative reciprocals of one another • Ex. m = ½ and m = -2 • Give another example! • Try guided practice 12 – 15
What’s the Slope? When given the graph, it is easier to apply “rise over run”.
Determine the slope of the line. Start with the lower point and count how much you rise and run to get to the other point! rise 3 = = run 6 6 3 Notice the slope is positive AND the line increases!
Slope and Rate of Change • In 2008, 23% of students at RHS were not proficient in mathematics. In 2012, 14% were not proficient. Find the rate of change.
Savings Account • Michael started a savings account with $300. After 4 weeks, he had $350 dollars, and after 8 weeks, he had $400. What is the rate of change of money in his savings account per week? • Find out how much money he would have after a year and a half.
Find the Slope • (-1, 4) and (1, -2) • (-5, 3) and (-6, -1) • (0, 5) and (4, ½)
Pop Quiz • Draw a map that represents function and a graph that represents a non-function. SHOW AND EXPLAIN WHY they represent functions/non-functions
Homework • Chapter 2.2 • 18 - 30 all, 38-46 all, 55-58 all • Read 2.3 and take notes!
Chapter 2.3 Mr. Hardy Algebra 2
DO NOW • Solve the equation • |x – 10| =17 • Solve for h • S = 2πrh + 2πr2 • Find the slope of a line given points: • (-⅕, ⅝) and (¾, -⅔)
Recall: Slope as a Rate of Change • You are driving from Grand Rapids, MI to Detroit, MI. You leave Grand Rapids at 4:00pm. At 5:10 pm you pass through Lansing, MI, a distance of 65 miles. • Approximately what time will you arrive in Detroit if it is 150 miles from Grand Rapids?
Discussion: Illegal Drug Use • Graph shows illegal drug use by age group. Find the slope of the line segment for ages 12-17. Describe what is means in practical terms.
Chapter 2.3- Quick Graphs • y-intercept • (0, b) • To find the y-intercept of a line, let x = 0 in the equation, then solve for y. • x-intercept • (a, 0) • To find the x-intercept of a line, let y = 0 in the equation, then solve for x.