Earth System Grid: Model Data Distribution & Server-Side Analysis to Enable Intercomparison Projects
UCRL-PRES-226277. Earth System Grid: Model Data Distribution & Server-Side Analysis to Enable Intercomparison Projects. PCMDI Software Team. Challenges facing ESG-CET. Building on the very successful CMIP3 IPCC AR4 ESG data portal.

Earth System Grid: Model Data Distribution & Server-Side Analysis to Enable Intercomparison Projects
E N D
Presentation Transcript
UCRL-PRES-226277 Earth System Grid: Model Data Distribution & Server-Side Analysis to Enable Intercomparison Projects PCMDI Software Team
Challenges facing ESG-CET • Building on the very successful CMIP3 IPCC AR4 ESG data portal. • How best to collect and distribute data on a much larger scale? • At each stage tools could be developed to improve efficiency • Substantially more ambitious community modeling projects (>~300 TBs) will require a distributed database • Metadata describing extended modeling simulations (e.g., atmospheric aerosols and chemistry, carbon cycle, dynamic vegetation, etc.) • How to make information understandable to end-users so that they can interpret the data correctly • More users from WGI. (Possibly WGII and WGIII?) • Client and Server-side analysis and visualization tools in a distributed environment (i.e., subsetting, concatenating, regridding, filtering, …) • Testbed needed by late 2008 – early 2009
IPCC Downloads (10/12/06) Nov 2004 – Oct 2006 ESG facts and figures ESG Objective CMIP3 IPCC AR4 ESG Portal To support the infrastructural needs of the national and international climate community, ESG is providing crucial technology to securely access, monitor, catalog, transport, and distribute data in today’s Grid computing environment. 28 TB of data at the PCMDI site location • 68,400 files • Generated by a modeling campaign coordinated by the Intergovernmental Panel on Climate Change • Model data from 11 countries 818 registered users Downloads to date • 123 TB • 543,500 files • 300 GB/day(average) Worldwide ESG user base 200 scientific papers published to date based on analysis of CMIP3 IPCC AR4 data
Providing climate scientists with virtual proximity to large simulation results needed for their research Current ESG Sites ESG Goal • Very large distributed data archives • Easy federation of sites • Across the US and around the world • “Virtual Datasets” created through • subsetting and aggregation • Metadata-based search and discovery • Web-based and analysis tool access • Increased flexibility and robustness • Server-side analysis http://www-pcmdi.llnl.gov
2006 Early 2009 2011 • Full data sharing (add to testbed…) • Synchronized federation • metadata, data • Full suite of server-sideanalysis with CDAT • Model/observation integration • ESG embedded into desktop productivity tools with CDAT • GIS integration • Model intercomparison metrics • User support, life cycle maintenance • Central database • Centralized curated data archive • Time aggregation • Distribution by file transport • No ESG responsibility for analysis • Shopping-cart-oriented web portal • ESG connection to desktop analysis tools (i.e., CDAT and CDAT-LAS) • Testbed data sharing • Federated metadata • Federated portals • Unified user interface • Quick look server-side analysis with CDAT • Location independence • Distributed aggregation • Manual data sharing • Manual publishing Evolving ESG for the future ESG Data System Evolution CCSM, AR5,satellite, In situ biogeochemistry,ecosystems CCSMAR4 ESG Data Archive Terabytes Petabytes
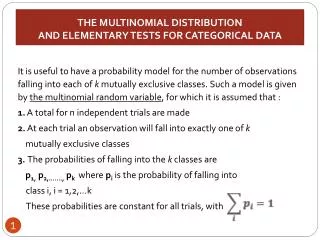
The growing importance of climate simulation data standards • Global Organization for Earth System Science Portal (GO-ESSP) • International collaboration to develop new generation of software infrastructure • Access to observed and simulated data from climate and weather communities • Working closely together using agreed upon standards • Last Annual meeting held at PCMDI • NetCDF Climate and Forecast (CF) Metadata Convention standards • Specify syntax and vocabulary for climate and forecast metadata • Promotes the processing and sharing of data • The use of CF was essential for the success of the IPCC data dissemination
Supporting CF and CMOR Future issues for CF • Develop further fundamental tools (such as Climate Model Output Rewriter - CMOR) • Develop staggered and unstructured grids • Deliver netCDF data into Geographical Information Systems (GIS) • Upgrade to netCDF-4 • Include in situ observations New CF website CF/CMOR Development • New CF website developed by PCMDI • repository • News • Documents • CF Conventions • CF Standard Name table • Conformance • Requirements & Recommendations • CF Compliance Checker • Mailing List • Archives
data provider data user ESG-CETarchitecture client service API serviceimplementation ? ARS mandatorycomponent deeparchivedata JOIN FEDERATION Architecture of thenext-generation ESG-CET • Huge data archives • Broader geographical distribution of archives • across the United States • around the world • Easy federation of sites • Increased flexibility and robustness browser browser Analysis Tool Analysis Tool AR5 ESG Gateway (PCMDI) centralizedsecurity services centralizedmetrics services userregistration securityservices monitoringservices metadata services notificationservices services startup/shutdown ESG Gateway (CCSM) ESG Gateway (CCES) OPeNDAP/OLFS(aggregation) product server publishing(harvester) storagemanagement backend analysisand vis engine workflow ESGnode ESGnode ESGnode ESGnode ESGnode ESGnode metricsservices replica location services replicamanagement ESG Node (GFDL) accesscontrol HTTP/FTP/GFTPservers metricsservices backend analysisand vis engine publishing(extraction) OPeNDAP/OLFS OPeNDAP/BS monitoringinfo provider storagemanagement diskcache onlinedata
UCRL-PRES-226277 Climate Data Analysis Tools: Software for Distributed Model Diagnosis & Intercomparison Research PCMDI Software Team
Challenges facing CDAT • Integrating CDAT into a distributed environment • Providing climate diagnostics • Delivering climate component software to the community • Working with other forms of climate Metadata describing extended modeling simulations (e.g., atmospheric aerosols and chemistry, carbon cycle, dynamic vegetation, etc.) • Testbed needed by late 2008 – early 2009
CDAT objectives CDAT Objectives Seamless mechanisms for climate information exploration and analysis.
Enabling data management, data analysis, and visualization for intercomparison research CDAT Goal What is CDAT? Address the challenges of enabling data management, discovery, access, and advanced data analysis for climate model diagnosis and intercomparison research. • CDAT IS Python! • Designed for climate science data • Scriptable • Open-source and free Typical usage examples of CDAT • Calculate a long-term average • Define wind-speed from u- and v-components • Subset a dataset, selecting a spatiotemporal region • Aggregate 1000s of files into a small XML file • Generate a Hovmoller plot
2006 Early 2009 • Testbed distributed analysis • Equal-access to shared resources (Web/Grid services) • Quick look server-side analysis tool for ESG • Diagnostics specific to AR5 • GFDL Ncvtk 3D visualization • Web-CDAT: discover, learn, and browse via web browser • Serving Google Maps and Google Earth Data with CDAT Evolving CDAT into an integrated client technology workplace CDAT Integrated Analysis Evolution 2011 • Community software • Python based • Start to finish environment • Diverse analysis tools • Languages: C/C++, Java, FORTRAN, Python • Platforms: Unix, Mac, Windows • VCDAT: discover, learn, and browse with a few clicks • Connection to ESG • Full analysis sharing • Full suite server-sideanalysis tool for ESG • ESG embedded into desktop productivity tools (i.e., CDAT) • GIS integration with CDAT • SciDAC VACET analysis and visualization collaboration • Global Organization for Earth System Science Portal (GO-ESSP) • Remote generic apps for ESG CDMS, Numeric,Genutil, Cdutil, Ncvtk, VACET,Diagnostics, ESG CDMS Numeric / MV Genutil / Cdutil VCS CDAT Core Modules Standalone Distributed
CDAT examples CDSCAN MV • Data aggregation: collections of files/datasets are treated as single entities. • Aspects of aggregation: • combining/merging variables, • joining variables, • new coordinate axes, • overlaying/adding metadata, • nesting datasets • PCMDI CDAT supports aggregations via the cdscan utility that uses XML representation • cdscan will analyse the archive for: • variable information • axis information • global (universal) metadata • Why use cdscan • Large datasets described as a grouped entity. • No need to know underlying data format. • No need to know file-names. • Datasets can be sliced in any way the user chooses using logical spatio-temporal selectors rather than loops of programming code. • You can use it to improve the metadata of your data files… • cdscan in action • $ cdscan –x monthly_means.xml ./*.nc >>> import cdms, MV >>> f_surface = cdms.open('sftlf_ta.nc') >>> surf = f_surface('sftlf') # Designate land where "surf" has values # not equal to 100 >>> land_only = MV.masked_not_equal(surf, 100.) >>> land_mask = MV.getmask(land_only) # Now extract a variable from another file >>> f = cdms.open('ta_1994-1998.nc') >>> ta = f('ta') # Apply this mask to retain only land values. >>> ta_land = cdms.createVariable(ta, mask=land_mask, copy=0, id='ta_land')
CDAT examples Regridder Ncvtk #!/usr/local/cdat/bin/python import cdms from regrid import Regridder f = cdms.open('temp.nc') t= f.variables['t'] ingrid = t.getGrid() outgrid = cdms.createUniformGrid( -90.0, 46, 4.0, 0.0, 72, 5.0) regridFunc = Regridder(ingrid, outgrid) newt = regridFunc(t) import vcs vcs.init().plot(t) vcs.init().plot(newt) Collaboration: CDAT developers are currently working with Ncvtk developers to make Ncvtk 3D graphics accessible to the CDAT community. Ncvtk is a collection of commonly used 3D visualization methods applied to data on structured lat/lon grids.
CDAT Users • Over 120 mailing list registers • Probably 7 to 10 times more casual users • Mailing list archive: over 1,000 message (~30 per month) • 912 Downloads since May 19, 2006 for version 4.1 • Improved Documentation CDAT Collaborations CDAT Core Modules Some CDAT development centers: • British Atmospheric Data Center • LBNL • GFDL • Laboratory of Science of Climate and the Environment (LSCE), FR • PCMDI • University of Chicago • University of Hawaii • University of Reading, UK CDAT facts and figures
Current Scenario Future Scenario • Search, browse and discover distributed data • Remote site • Request data • Regrids • Diagnostics • ESG returns results • Browse PCMDI’s centralized database • Download data • Organize data on local site • Regrid data at local site • Perform diagnostics • Produces results Simple intercomparison use case scenario