Water Resources
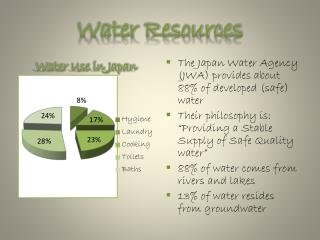
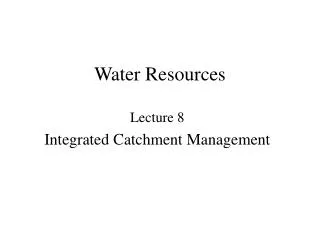
Water Resources. All water. Fresh water. Readily accessible fresh water. Groundwater 0.592%. Biota 0.0001%. Rivers 0.0001%. Lakes 0.007%. Lakes 0.007%. 0.014%. Fresh water 2.6%. Oceans and saline lakes 97.4%. Ice caps and glaciers 1.984%. Soil moisture 0.005%.

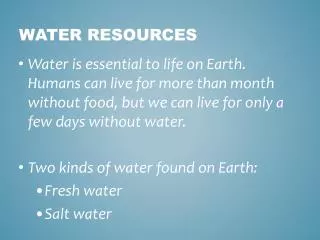
Water Resources
E N D
Presentation Transcript
All water Fresh water Readily accessible fresh water Groundwater 0.592% Biota 0.0001% Rivers 0.0001% Lakes 0.007% Lakes 0.007% 0.014% Fresh water 2.6% Oceans and saline lakes 97.4% Ice caps and glaciers 1.984% Soil moisture 0.005% Oceans and saline lakes 97.4% Ice caps and glaciers 1.984% Atmospheric water vapor 0.001% Soil moisture 0.005%
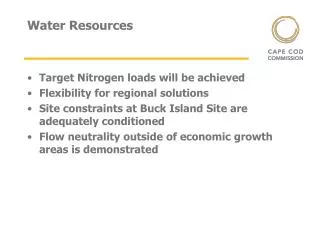
Flowing artesian well Unconfined Aquifer Recharge Area Well requiring a pump Precipitation Evaporation and transpiration Evaporation Confined Recharge Area Runoff Stream Recharge Unconfined Aquifer Infiltration Water table Lake Infiltration Less permeable material such as clay Unconfined aquifer Confined aquifer Confiningimpermeable rock layer
United States China Agriculture 41% Agriculture 87% Power cooling 38% Public 6% Industry 7% Industry 11% Public 10%
400,000 liters (106,000 gallons) 1 automobile 1 kilogram cotton 10,500 liters (2,400 gallons) 1 kilogram aluminum 9,000 liters (2,800 gallons) 1 kilogram grain-fed beef 7,000 liters (1,900 gallons) 1 kilogram rice 5,000 liters (1,300 gallons) 1 kilogram corn 1,500 liters (400 gallons) 1 kilogram paper 880 liters (230 gallons) 220 liters (60 gallons) 1 kilogram steel
Downstream cropland and estuaries are deprived of nutrient-rich silt Flooded land destroys forests or cropland and displaces people Large losses of water through evaporation Downstream flooding is reduced Provides water for year-round irrigation of cropland Reservoir is useful for recreation and fishing Can produce cheap electricity (hydropower) Migration and spawning of some fish are disrupted Effects of Water Diversions/Dams
IDAHO WYOMING Dam Aqueduct or canal Salt Lake City Grand Junction Upper Basin Denver Lower Basin UPPER BASIN UTAH COLORADO Lake Powell Grand Canyon Glen Canyon Dam Las Vegas NEW MEXICO Boulder City ARIZONA CALIFORNIA Albuquerque LOWER BASIN Los Angeles Palm Springs Phoenix 0 100 mi. San Diego Yuma 0 150 km Mexicali Tucson All-American Canal Gulf of California MEXICO
CALIFORNIA NEVADA Shasta Lake UTAH Oroville Dam and Reservoir Sacramento River Feather River Lake Tahoe North Bay Aqueduct Sacramento San Francisco Hoover Dam and Reservoir (Lake Mead) Fresno South Bay Aqueduct Colorado River Los Angeles Aqueduct San Luis Dam and Reservoir ARIZONA California Aqueduct Central Arizona Project Santa Barbara Colorado River Aqueduct Los Angeles Phoenix Salton Sea San Diego Tucson MEXICO
CANADA Hudson Bay Chisasibi NEWFOUNDLAND II James Bay I ONTARIO II QUEBEC New York City ATLANTIC OCEAN Chicago UNITED STATES
Trade-Offs China’s Three Gorges Dam Advantages Disadvantages Will generate about 10% of China’s electricity Reduces dependence on coal Reduces air pollution Reduces CO2 emissions Reduces chances of downstream flooding for 15 million people Reduces river sitting below dam by eroded soil Increases irrigation water for cropland below dam Floods large areas of cropland and forests Displaces 1.9 million people Increases water pollution because of reduced water flow Reduces deposits of nutrient- rich sediments below dam Increases saltwater Introduced into drinking water near mouth of river because of decreased water flow Disrupts spawning and migration of some fish below dam High cost
Groundwater Overdrafts: High Moderate Minor or none
Major irrigation well Well contaminated with saltwater Water table Sea Level Salt water Fresh groundwater aquifer Interface Interface Saltwater Intrusion Normal Interface
Trade-Offs Withdrawing Groundwater Advantages Disadvantages Aquifier depletion from over- pumping Sinking of land (subsidence) when water removed Polluted aquifiers unusable for decades or centuries Saltwater intrusion into drinking water supplies near coastal areas Reduced water flows into streams, lakes, estuaries, and wetlands Increased cost, energy use, and contamination from deeper wells Good source of water for drinking and irrigation Available year-round Exists almost everywhere Renewable if not over- pumped or contaminated No evaporation losses Cheaper to extract than most surface waters
Solutions Groundwater Depletion Prevention Control Raise price of water to discourage waste Tax water pumped from Wells near surface water Set and enforce minimum stream flow levels Waste less water Subsidize water conservation Ban new wells in aquifiers near surface waters Buy and retire ground- water withdrawal rights in critical areas Do not grow water- intensive crops in dry areas Reduce birth rates
WYOMING SOUTH DAKOTA Less than 61 meters (200 ft) 61-183 meters (200-600 ft) More than 183 meters (600 ft) (as much as 370 meters or 1,200 ft. in places) NEBRASKA KANSAS COLORADO OKLAHOMA NEW MEXICO TEXAS Miles Ogalala Aquifer 0 100 0 160 Kilometers
Center Pivot (efficiency 80% with low-pressure sprinkler and 90–95% with LEPA sprinkler) Water usually pumped from underground and sprayed from mobile boom with sprinklers. Drip Irrigation (efficiency 90-95%) Above- or below-ground pipes or tubes deliver water to individual plant roots. Gravity Flow (efficiency 60% and 80% with surge valves) Water usually comes from an aqueduct system or a nearby river.
Reservoir Dam Levee Flood wall Floodplain
Oxygen released by vegetation Diverse ecological habitat Evapotranspiration Trees reduce soil erosion from heavy rain and wind Agricultural land Steady river flow Leaf litter improves soil fertility Tree roots stabilize soil and aid water flow Vegetation releases water slowly and reduces flooding Forested Hillside
Tree plantation Evapotranspiration decreases Roads destabilize hillsides Ranching accelerates soil erosion by water and wind Winds remove fragile topsoil Agriculture land is flooded and silted up Gullies and landslides Heavy rain leaches nutrients from soil and erodes topsoil Rapid runoff causes flooding Silt from erosion blocks rivers and reservoirs and causes flooding downstream After Deforestation
Figure 15-26Page 329 Solutions Sustainable Water Use • Not depleting aquifers • Preserving ecological health of aquatic systems • Preserving water quality • Integrated watershed management • Agreements among regions and countries sharing surface water resources • Outside party mediation of water disputes between nations • Marketing of water rights • Raising water prices • Wasting less water • Decreasing government subsides for supplying water • Increasing government subsides for reducing water waste • Slowing population growth