Download
1 / 43
430 likes | 579 Vues
Water Resources. G. Tyler Miller’s Living in the Environment 13 th Edition Chapter 14. Dr. Richard Clements Chattanooga State Technical Community College Modified by Charlotte Kirkpatrick. Key Concepts. The physical properties of water. Availability of fresh water.

E N D
Water Resources G. Tyler Miller’s Living in the Environment 13th Edition Chapter 14 Dr. Richard Clements Chattanooga State Technical Community College Modified by Charlotte Kirkpatrick
Key Concepts • The physical properties of water • Availability of fresh water • Methods of increasing freshwater supplies • Using water more efficiently • Problems associated with flooding
Water’s Unique Properties • Hydrogen bonding: strong forces of attraction between water molecules. Main reason for water’s unique properties • Liquid over wide temperature range: liquid in most climates on earth • Changes temperature slowly: high heat capacity; translates into an excellent coolant • High heat of evaporation: requires large amounts of heat to evaporate and therefore is an effective cooling process.
Water phase diagram • Sublimation is the phase change as a substance changes from a solid to a gas without passing through the intermediate state of a liquid. • Deposition is the phase change as a substance changes from a gas to a solid without passing through the intermediate state of a liquid. • TRIPLE POINT - The temperature and pressure at which the solid, liquid, and gas phases exist simultaneously. • CRITICAL POINT - The temperature above which a substance will always be a gas regardless of the pressure. • NOTE: • The solid phase is more dense than the liquid phase. Except in water • The line between the solid and liquid phases is a curve of all the freezing/melting points of the substance. • The line between the liquid and gas phases is a curve of all the boiling points of the substance. • Freezing Point - The temperature at which the solid and liquid phases of a substance are in equilibrium at atmospheric pressure. • Boiling Point - The temperature at which the vapor pressure of a liquid is equal to the pressure on the liquid. • Normal (Standard) Boiling Point - The temperature at which the vapor pressure of a liquid is equal to standard pressure (1.00 atm = 760 mmHg = 760 torr = 101.325 kPa)
Generic Heating and Cooling Curve • Freezing is the phase change as a substance changes from a liquid to a solid. • Melting is the phase change as a substance changes from a solid to a liquid. • Condensation is the phase change as a substance changes from a gas to a liquid. • Vaporization is the phase change as a substance changes from a liquid to a gas.
Water’s Unique Properties • Great dissolving power: dissolves many things well and this makes it a good dilution agent and easily polluted • pH: maintains balance between acids and bases • Water filters UV radiation: protects aquatic organisms • Adhesion and cohesion: due to the H-bonds; allows for water molecules to pull together tightly (cohesion) and for high wetting ability of solids (adhesion) • Expands when it freezes: unlike other liquids water expands when it freezes allowing a lake to freeze over from the top down
Supply of Water Resources Readily accessible freshwater Freshwater (2.6% of all water) Biota 0.0001% Groundwater (unaccessible) 0.592% Lakes 0.007% Rivers 0.0001% 0.014% Ice caps and glaciers 1.984% Soil moisture 0.005% Atmospheric water vapor 0.001% Fig. 14-2 p. 314
Figure 14-2Page 314 Supply of Water Resources Fresh water All water Readily accessible fresh water Biota 0.0001% Groundwater 0.592% Lakes 0.007% Rivers 0.0001% Lakes 0.007% 2.6% 0.014% Atmospheric water vapor 0.001% Oceans and saline lakes 97.4% Ice caps and glaciers 1.984% Soil moisture 0.005% Ice caps and glaciers 1.984% Oceans and saline lakes 97.4% Soil moisture 0.005%
Ground Water/Water Cycle Flowing artesian well Precipitation Evaporation and transpiration Well requiring a pump Evaporation Confined Recharge Area Runoff Aquifer Stream Infiltration Water table Lake Infiltration Unconfined aquifer Confined aquifer Less permeable material such as clay Confirming permeable rock layer Fig. 14-3 p. 315
Surface Water • Surface runoff:. precipitation that does not infiltrate into the ground or return to the atmosphere by evaporation/transpiration • Reliable runoff: Runoff that is not lost due to seasonal floods. • Watershed (also known as a Drainage Basin): a region from which water drains into a stream, lake, reservoir, wetland, or other body of water. www.ocwatersheds.com
Ground Water/Water Cycle Groundwater: precipitation that infiltrates the ground and percolates downward through voids (pores, fractures, crevices, and other spaces) in soil and rock. Voids are completely filled some depth below in the zone of saturation. Water Table: the top of the zone of saturation Zone of aeration: above the water table where soil may be moist but not saturated
Ground Water/Water Cycle Aquifer: porous water saturated layers of sand, gravel or bedrock in which ground water flows. Recharge area: any are of land in which water passes downward or laterally into an aquifer Natural recharge: when aquifers are replenished by precipitation that percolates downward through soil and rock. May be lateral recharge as well. Groundwater moves from high to low elevation and and pressure at about1m/yr.
Ground Water/Water Cycle Flowing artesian well Precipitation Evaporation and transpiration Well requiring a pump Evaporation Confined Recharge Area Runoff Aquifer Stream Infiltration Water table Lake Infiltration Unconfined aquifer Confined aquifer Less permeable material such as clay Confirming permeable rock layer Fig. 14-3 p. 315
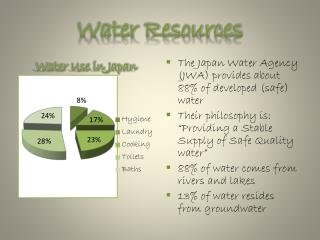
Water Use: increased ninefold and per capita withdrawal has quadrupled with irrigation the largest increase since 1900.
Use of Water Resources • Humans use more than half of the reliable runoff: 35% is used directly and the other 20 % is left in streams to transport goods by boats, dilute pollution and sustain fisheries and wildlife Worldwide use: • Agriculture: 70% (irrigate 18% of world’s cropland and produce 40% of world’s food) • Industry: 20% • Domestic: 10%
Figure 14-5Page 316 Use of Water Resources United States China Agriculture 41% Agriculture 87% Power cooling 38% Public 6% Industry 7% Industry 11% Public 10% Largest use at 4800 liters/day (1280 gal./day) per person
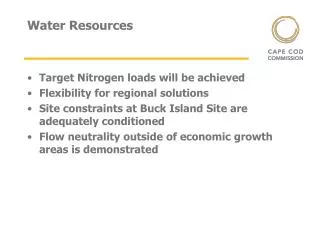
Average annual precipitation (centimeters) Acute shortage Adequate supply Shortage Metropolitan regions with population greater than 1 million Less than 41 41-81 81-22 More than 122
Water Used to Produce Some Common Agricultural and Manufactured Products
Too Little Water (causes) • Dry climate (see fig. 6-7 pg. 116) • Drought: 21 days or longer in which precipitation is at least 70% lower and evaporation is higher than normal • Dessication: drying of the soil caused by overgrazing and deforestation • Water stress: low per capita availability of water caused by increasing numbers of people relying on limited runoff levels. Per person reliable runoff below 1700 cubic meters/year • Water Scarcity: less than 1000 cubic meters/year per person
Water Stress: based on amount available with amount used by humans
How Can We Increase Freshwater Supplies Build dams and reservoirs to store runoff Bring in surface water from another area Withdraw groundwater convert salt water to freshwater (desalination) Waste less water import food to reduce water use In developed countries we live where it is nice and bring water in In developing countries they must settle where the water is
Using Dams and Reservoirs to Supply More Water Downstream cropland and estuaries are deprived of nutrient-rich silt Flooded land destroys forests or cropland and displaces people Large losses of water through evaporation Downstream flooding is reduced Reservoir is useful for recreation and fishing Provides water for year-round irrigation of cropland Can produce cheap electricity (hydropower) Migration and spawning of some fish are disrupted Fig. 14-9 p. 319
Dams and Reservoirs • Main purpose: controlling floods and producing hydroelectric power and supplying water for irrigation. Reservoirs also provide recreational activities. • U.S. has more than 70,000 dams controlling a bout half of the country’s entire river flow. • This often impairs the important ecological services that rivers provide
Dams and Reservoirs • Many rivers have been so controlled that the downstream flow is reduced to a trickle and many never reach the ocean/sea before drying out. Especially in arid regions. Ex. Colorado River, Rio Grande, Yellow, Nile, Ganges, Indus, Amu Darya and Syr Darya. • Some countries have taken steps to remove old, dangerous, or environmentally harmful dams **Know case studies on pp. 320-322
Transferring Water from One Place to Another • Watershed transfer: transfer water from water rich area to water poor area. A variety of tunnels, aqueducts, and underground pipes and pumps can transfer stream runoff collected by dams and reservoirs. • Very visual example of the environmental principle of “you can’t do just one thing”. • Largest is the CA. Water Transfer Project: 75% of the water is in the north yet, 75% of the population is in the south. Other ex. Arizona and James Bay water transfer projects (know case studies p. 323-324)
Transferring Water from One Place to Another CALIFORNIA NEVADA UTAH Shasta Lake Sacramento River Sacramento North Bay Aqueduct San Francisco Fresno South Bay Aqueduct Colorado River Los Angeles Aqueduct ARIZONA California Aqueduct Central Arizona Project Los Angeles Phoenix San Diego Colorado River Aqueduct Tucson MEXICO Fig. 14-13/14-14 p. 323
California Water Resources Blue: Rivers Red: State water Projects Yellow: Federal water projects Green: Local water projects
Tapping Groundwater • Removed as needed year-round • No evaporation losses • Often less expensive than taping from streams • Potential Problems!
Problems with Using Groundwater • Water table lowering (See Fig. 14-15 p. 326) Due to excessive extraction the water table can be lowered as a cone of depression occurs. Original water table Initial water table Cone of depression Lowered water table
Problems with Using Groundwater • Subsidence:Sinking of land when groundwater is withdrawn • Depletion from groundwater overdraft High High Moderate Moderate (See Fig. 14-16 p. 326) Minor or none Minor or none
Problems with Using Groundwater • Saltwater intrusion (See Fig. 14-17 p. 328) Major irrigation well Well contaminated with saltwater Water table Sea Level Salt water Fresh groundwater aquifer Interface Interface Normal Interface Saltwater Intrusion • Chemical contamination • Reduced stream flows
Water Mining • Water pumping at high rates that exceed the natural rate of recharge. • This unsustainable over pumping of aquifers produces about 8% of the world’s grain harvest. This is causing water tables to fall. • About 480 million of the world’s people are being fed with grain produced with eventually unsustainable water mining from aquifers.
Water Mining • Overpumping has increased since 1950 due to more powerful electric and diesel pumps • It limits future food production as well as • Increasing the gap between rich and poor
Converting Salt Water to Fresh Water and Making it Rain • Distillation desalination • Reverse osmosis desalination • Desalination is very expensive • Cloud seeding
Using Water More Efficiently • Reduce losses due to leakage • Reform water laws • Improve irrigation efficiency (Fig. 14-18 p. 330) • Improving manufacturing processes • Water efficient landscaping • Water efficient appliances
Figure 14-20Page 331 Saving water in industry, businesses and residences • Redesign manufacturing processes • Landscape yards with plants that require little water • Use drip irrigation • Fix water leaks • Use water meters and charge for all municipal water use • Raise water prices • Require water conservation in water-short cities • Use water-saving toilets, showerheads, and front- loading clothes washers • Collect and reuse household water to irrigate lawns and nonedible plants • Purify and reuse water for houses, apartments, and office buildings
Too Much Water: Floods • Natural phenomena • Aggravated by human activities • Renew and replenish Reservoir Dam Levee Flood wall Floodplain Fig. 14-22 p. 332
Solutions: Achieving a More Sustainable Water Future • Efficient irrigation • Water-saving technologies • Improving water management
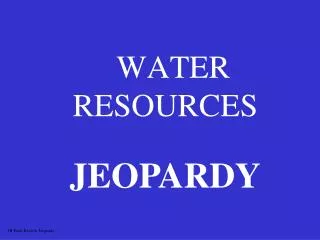
Figure 14-18Page 330 Irrigation Techniques Gravity Flow (efficiency 60% and 80% with surge valves) Water usually comes from an aqueduct system or a nearby river. Center Pivot (efficiency 80% with low-pressure sprinkler and 90–95% with LEPA sprinkler) Water usually pumped from underground and sprayed from mobile boom with sprinklers. Drip Irrigation (efficiency 90-95%) Above- or below-ground pipes or tubes deliver water to individual plant roots.
Figure 14-19Page 331 • Lining canals bringing water to irrigation ditches • Leveling fields with lasers • Irrigating at night to reduce evaporation • Using soil and satellite sensors and computer systems to monitor soil moisture and add water only when necessary • Polyculture • Organic farming • Growing water-efficient crops using drought-resistant and salt-tolerant crop varieties • Irrigating with treated urban waste water • Importing water-intensive crops and meat Agricultural changes to increase water supply
Figure 14-25Page 336 • Not depleting aquifers • Preserving ecological health of aquatic systems • Preserving water quality • Integrated watershed management • Agreements among regions and countries sharing surface water resources • Outside party mediation of water disputes between nations • Marketing of water rights • Wasting less water • Decreasing government subsides for supplying water • Increasing government subsides for reducing water waste • Slowing population growth Encouraging Sustainable Use of water