Download
1 / 18
190 likes | 407 Vues
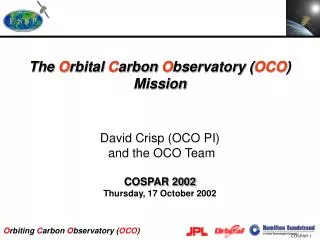
The O rbital C arbon O bservatory ( OCO ) Mission David Crisp (OCO PI) and the OCO Team COSPAR 2002 Thursday, 17 October 2002. C. O. O. Atmosphere. ?. ?. Human Activity. Ocean. Land. Why Measure CO 2 ?. ISSUES: Carbon dioxide (CO 2 ) is the

E N D
The Orbital Carbon Observatory (OCO) Mission David Crisp (OCO PI) and the OCO Team COSPAR 2002 Thursday, 17 October 2002
C O O Atmosphere ? ? Human Activity Ocean Land Why Measure CO2? ISSUES: Carbon dioxide (CO2) is the • Principal atmospheric component of the global carbon cycle • Primary anthropogenic driver of climate change • Only half of CO2 produced by human activities over the past 30 years has remained in the atmosphere. • Where are the sinks? • Will this continue?
The Global Carbon Cycle Natural carbon fluxes account for 300 GtC/yr and exist in near equilibrium. 6 GtC/yr The ~6 GtC/yr produced by human activity represents only 2% of the carbon flux, but it may tip the balance
20 Global Mean Temperature 19 18 17 16 Celsius 15 14 13 1850 1900 1950 2000 2050 2100 An Uncertain Future:Where are the Missing Carbon Sinks? • What are the relative roles of the oceans and land ecosystems in absorbing CO2? • Is there a northern hemisphere land sink? • What are the relative roles of North America/ Eurasia • What controls carbon sinks? • Why does the atmospheric buildup vary with uniform emission rates? • How will the sinks respond to climate change? • Climate prediction requires an improved understanding of natural CO2 sinks • Future atmospheric CO2 increases • Their contributions to global change Cox et al.Nature, 408, 184, 2000.
Why Measure CO2 from Space?Improved CO2 Flux Inversion Capabilities • Current State of Knowledge • Global maps of carbon flux errors for 26 continent/ocean-basin-sized zones retrieved from inversion studies • Studies using data from the 56 GV-CO2 stations • Flux residuals exceed 1 GtC/yr in some zones • Network is too sparse • Inversion tests • global XCO2 pseudo-data with 1 ppm accuracy • flux errors reduced to <0.5 GtC/yr/zone for all zones • Global flux error reduced by a factor of ~3. 1.0 0.5 0.0 Flux Retrieval Error GtC/yr/zone 1.0 0.5 0.0 Rayner & O’Brien, Geophys. Res. Lett. 28, 175 (2001)
The Orbiting Carbon Observatory (OCO) Mission • OCO will use mature technologies to: • Make the first, global, space-based observations of the column integrated dry air mole fraction, XCO2 • Provide independent data validation approaches to ensure high accuracy (1 ppm, 0.3%) • Combine satellite data with ground-based measurements to characterize CO2 sources and sinks on regional scales on monthly to interannual time scales • Fly in formation with the A-Train to facilitate coordinated observations and validation plans
OCO Science Team David Crisp, PI Charles Miller, Deputy PI Education Gil Yanow Retrieval Algorithms D. O’Brien G. Stephens G. Toon Y. Yung Cal/Val F. Bréon L. Brown J. Burrows P. Ciais B. Connor C. Miller R. Salawitch S. Sander P. Tans P. Wennberg S. Wofsy Source/Sink Modeling R. Atlas S. Doney I. Fung D. Jacob S. Pawson J. Randerson P. Rayner Ground Data System Interface B. Sen
2.06 XCO2 Retrieved from Bore-Sited CO2 and O2 Spectra Taken Simultaneously • High resolution spectroscopic measurements of reflected sunlight in near IR CO2 and O2 bands provide the data needed to retrieve XCO2 • Column-integrated CO2 abundance • Maximum contribution from surface • Other data needed (provided by OCO) • Surface pressure, albedo, atmospheric temperature, water vapor, clouds, aerosols • Why high spectral resolution? • Lines must be resolved from the continuum to minimize systematic errors Clouds/Aerosols, Surface Pressure Column CO2 Clouds/Aerosols, H2O, Temperature
810 45 Spatial Sampling Strategy • OCO is designed provide an accurate description of XCO2 on regional scales • Atmospheric motions mix CO2 over large areas as it is distributed through the column • Source/Sink model resolution limited to 1o x 1o • High spatial resolution • 1 km x 1.5 km footprints • Isolates cloud-free scenes • Provides thousands of samples on regional scales Spatial sampling along ground track Ground tracks over the tip of South America
Nadir Mode Glint Mode Target Mode Operational Strategy • 1:15 PM near polar (98.2o) orbit • 15 minutes ahead of EOS A-Train • Same ground track as AQUA • Global coverage every 16 days • Science data taken on day side • Nadir mode • Highest spatial resolution • Glint mode • Highest SNR over ocean • Target mode • Validation • airmass dependence • Comparison with surface FTS stations • Calibration data taken on night side • Solar, limb, dark, lamp
Will it Work? • Accuracies of 1ppm needed to identify CO2 sources and sinks. • Realistic, end-to-end, Observational System Simulation Experiments • Reflected radiances for a range of atmospheric/surface conditions • line-by-line multiple scattering models • Comprehensive description of • mission scenario • instrument characteristics • Results: The OCO payload will • meet or exceed the requirements for measuring CO2 • provide rigorous constraints on the distribution and optical properties of clouds and aerosols End-to-end retrievals of XCO2 from individual simulated nadir soundings at SZAs of 35o and 75o. The model atmospheres include sub-visual cirrus clouds (0.02c 0.05), light to moderate aerosol loadings (0.05a 0.15), over ocean and land surfaces. INSET: Distribution of XCO2 errors (ppm) for each case
Validation Program Ensures Accuracy and Minimizes Spatially Coherent Biases • Ground-based in-situ measurements • NOAA CMDL Flask Network + Tower Data • TAO/Taurus Buoy Array • Uplooking FTS measurements of XCO2 • 3 funded by OCO • 4 upgraded NDSC • Aircraft measurements of CO2 profile • Complemented by Laboratory and on-orbit calibration Buoy Network CMDL
The OCO Implementation Team ESSP PMO
OCO Mission Concept Simple, Mature 3-channel Spectrometer Ground Validation Sites Dedicated Spacecraft Data Processing Center 2007 Launch Mission Ops Ground Stations Data Products
OCO Instruments • Three bore-sighted, high resolution, grating spectrometers • CO2 1.6 m band • CO2 2.0 m band • O2 0.76 m A-band • Similar optics and electronics • 200 mm F/2 refractive optics • Spectral Resolution ~20,000 • RSC Hawaii HgCdTe FPAs for CO2 channels • RSC HyViSI FPA for O2 channel • Existing Designs For Critical Components • Hubble WFC-3 detectors • Build-to-Print Aura HIRDLS cooler • Provided by Hamilton Sundstrand Sensor Systems(Pomona Ca)
OCO Spacecraft • 4th build of Orbital LEOStar-2 Bus • Orbview 4, GALEX, SORCE • Now in NASA’s RSDO Catalog • Satisfies all OCO Requirements with large margins
JAN JUL APR OCT OCO Data Product Pipeline AIRS: T, P, H2O • The OCO data flow from space through an automated pipeline which yields Level 1 and 2 data products. • Level 3 and Level 4 products are produced by individual Science Team members. • Preliminary tests of the retrieval algorithm demonstrate the OCO mission concept • (Kuang et al., Geophys. Res. Lett., 29 (15) 2001GL014298, 2002). Space-borne Data Acquisition Level 2 Calibration & Validation Data Spectral Radiances Level 3 Ancillary Data FTIR: XCO2 GVCO2: [CO2] MODIS: Aerosol NCEP Fields Global 1ppm XCO2 Maps Inversion Models Data Assimilation Models Level 4 Temporally Varying CO2 Source/Sink Maps
Summary • Climate Forcing/Response • T/H2O/O3 AIRS/TES/MLS • Clouds CloudSat • Aerosols CALIPSO • CO2 OCO • OCO will provide critical data for • Understanding the carbon cycle • Essential for developing carbon management strategies • Predicting weather and climate • Understanding sources/sinks essential for predicting CO2 buildup • O2 A-Band will provide global surface pressure measurements • OCO validates technologies critically needed for future operational CO2 monitoring missions • Satisfies an unaccommodated measurement need identified by NPOESS XCO2 (ppm)