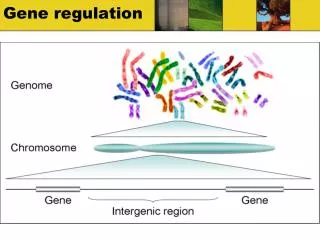
Gene Regulation
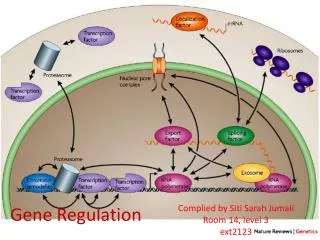
Measured by gene expression microarrays. Gene Regulation. [Segal et al.]. System Biology Gene expression: two-phase process Gene is transcribed into mRNA mRNA is translated Protein Genes that are similar expressed are often coregulated and involved in the same cellular processes

Gene Regulation
E N D
Presentation Transcript
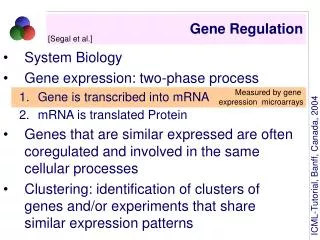
Measured by gene expression microarrays Gene Regulation [Segal et al.] • System Biology • Gene expression: two-phase process • Gene is transcribed into mRNA • mRNA is translated Protein • Genes that are similar expressed are often coregulated and involved in the same cellular processes • Clustering: identification of clusters of genes and/or experiments that share similar expression patterns
Gene Regulation [Segal et al.] • System Biology: heterogenous data • Limitations of Clustering: • Similarities over all measurements • Difficult to incorporate readily background knowledge such as clinical data or experimental details
Gene Cluster Array Cluster GeneCluster/1 ArrayPhase/1 Gene Features, such as function, localization, ... ArrayCluster/1 AminoAcid Metabolism/1 GCN4/1 Lipid/1 inArray/2 Relational context Cytoplasm/1 ofGene/2 ExpressionLevel/1 Relational context Gene Regulation [Segal et al., simplified representation]
Gene Regulation [Segal et al.] • Synthatic data: 1000 genes, 90 arrays (= 90.000 measurements), each gene 15 functions and 30 transcription factors.
Gene Regulation [Segal et al.] • Real world data: predicting the array cluster of an array without performing the experiment • Link introduced between arrays and genes • Outside the scope of other approaches !
Protein Fold Recognition [Kersting et al.; Kersting, Gaertner] • Comparison of protein structure is fundamental to biology, e.g. function prediction • Two proteins show sufficient sequence similarity = essentially adopt the same structure. • If one of the two similar proteins has a known • structure, can build a rough model of the protein of • unknown structure.
helix type of helix quantized number of acids length orientation strand Protein Secondary Structure [Kersting et al.; Kersting, Gaertner] [helix(h(right,3to10),5), helix(h(right,alpha),13), strand(null,7), strand(minus,7), strand(minus,5), helix(h(right,3to10),5),…]
Model [Kersting et al.] ~120 parameters vs. over 62000 parameters Secondary structure of domains of proteins (from PDB and SCOP) fold1: TIM beta/alpha barrel fold, fold2: NAD(P)-binding Rossman-fold fold23: Ribosomal protein L4, fold37: glucosamine 6-phosphate deaminase/isomerase old fold55: leucine aminopeptidas fold. 3187 logical sequences (> 30000 ground atoms)
Results [Kersting et al.; Kersting, Gaertner] New Class of relational Kernels (see Thomas Gaertner´s Tutorial on Kernels for Structured Data). • Accuracy: 74% vs. 82.7%(1622 vs. 1809/ 2187) • Majority vote: 43%
mRNA [Kersting et al.; Kersting, Gaertner] • Science Magazine: RNA one of the runner-up breakthroughs of the year 2003. • Identifying subsequences in mRNA that are responsible for biological functions. • Secondary structures of mRNAs form tree structures: not easily for HMMs
mRNA [Kersting et al.; Kersting, Gaertner]
mRNA [Kersting et al.; Kersting, Gaertner] 93 logical sequences (in total 3122 ground atoms) • 15 and 5 SECIS (Selenocysteine Insertion Sequence), • 27 IRE (Iron Responsive Element), • 36 TAR (Trans Activating Region) and • 10 histone stemloops. Leave-one-out crossvalidation: Plug-In Estimates: 4.3 % error Fisher kernels SVM: 2.2 % error
Web Log Data [Anderson et al.] • Log data of web sides • KDDCup 200 (www.gazelle.com) • RMM over
User Log Data [Anderson et al.]
Collaborative Filterting [Getoor, Sahami] • User preference relationships for products / information. • Traditionally: single dyactic relationship between the objects. ... buys11 buys12 buysNM ... ... classPersN classProd1 classProd2 classProdM classPers1 classPers2
Relational Naive Bayes Collaborative Filtering [Getoor, Sahami; simplified representation] buys/2 topicPage/1 reputationCompany/1 visits/2 classProd/1 classPers/1 manufactures subscribes/2 topicPeriodical/1 colorProd/1 costProd/1 incomePers/1