THE HYPERBOLA
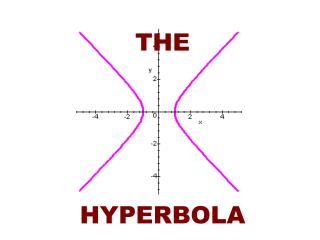
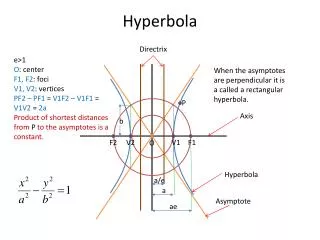
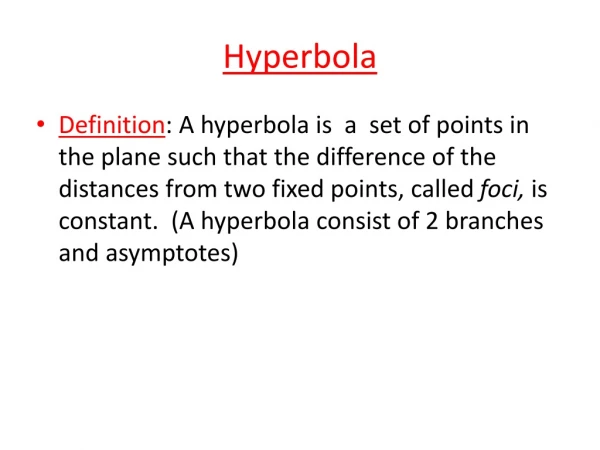
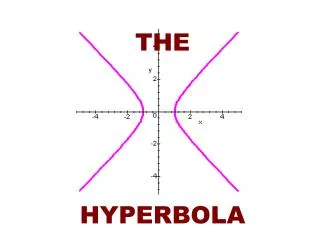
THE HYPERBOLA. A hyperbola is the collection of all points in the plane the difference of whose distances from two fixed points, called the foci , is a constant. This is the same definition as an ellipse except we have the difference is always constant instead of the sum.

THE HYPERBOLA
E N D
Presentation Transcript
THE HYPERBOLA
A hyperbola is the collection of all points in the plane the difference of whose distances from two fixed points, called the foci, is a constant. This is the same definition as an ellipse except we have the difference is always constant instead of the sum. The hyperbola has two symmetric parts called branches. Each branch has a vertex and a focus. The axis that contains the vertices is called the transverse axis.
PARTS OF A HYPERBOLA The black dashes lines are asymptotes for the graphs. conjugate axis vertices vertices transverse axis center foci foci
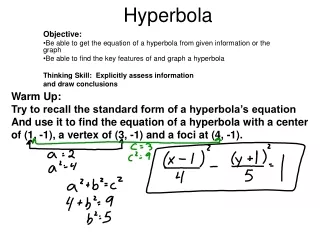
The equation for a hyperbola can be derived by using the definition and the distance formula. It is derived in your book on pages 792-93. The resulting equation is: This looks similar to the ellipse equation but notice the sign difference. To graph a hyperbola, make a rectangle that measures 2a by 2b as a sketching aid and draw the diagonals. These are the asymptotes. b c a a b
a a b b Find the vertices and foci and graph the hyperbola: The ends of the transverse axis are the vertices and the axis is 2a long. From the center the ends of the transverse axis are "a" each direction. "a" is the square root of this value From the center the ends of the conjugate axis are "b" each direction. "b" is the square root of this value (-3, 0) (3, 0) To find the foci, they are "c" away from the center in each direction. Find "c" by the equation: Make a rectangle & draw diagonals for the asymptotes.
a a b b Let's find the equations of the asymptotes. They are lines with y intercept of 0. The second line has the same slope only negative. What is the slope of this line? hint: rise over run Can you see this would be b over a or in this case, up two, over three or 2/3? (-3, 0) (3, 0)
The center of the hyperbola may be transformed from the origin. The equation would then be: horizontal transverse axis vertical transverse axis The axis is determined by the first term NOT by which denominator is the largest. If the x term is positive it will be horizontal, if the y term is the positive term it will be vertical. The axis is determined by the first term NOT by which denominator is the largest. If the x term is positive it will be horizontal, if the y term is the positive term it will be vertical.
Find the center, foci, vertices and graph the ellipse complete the square on the x terms and then on the y terms 1 1 1 1 We grouped the y terms and factored out a 4 and grouped the x terms and factored out a -3. The y squared term is first because it is positive. The right hand side must be a 1 so divide all terms by 12 1 12 12 12 4 3 This is now in standard form and we are ready to find what we need and graph (next screen)
The center is at (h, k). In this case (1, -1). this is a2 so a = square root of 3 this is b2 so b = 2 a = square root 3 so the vertices (on the transverse axis) are square root of 3 each way from the center. Since it is the y term that is positive, we move square root of 3 each way in the y direction. so vertices are: To find foci: (1, -1) So foci are: Make the rectangle and asymptotes to help you graph