HYPERBOLA
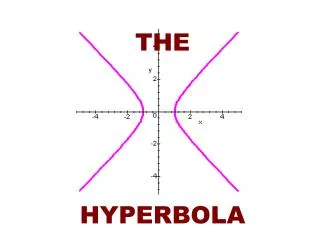
HYPERBOLA. PARTS OF A HYPERBOLA. The dashed lines are asymptotes for the graphs. conjugate axis. vertices. vertices. transverse axis. center. Focus 1. Focus 2.

HYPERBOLA
E N D
Presentation Transcript
PARTS OF A HYPERBOLA The dashed lines are asymptotes for the graphs conjugate axis vertices vertices transverse axis center Focus 1 Focus 2
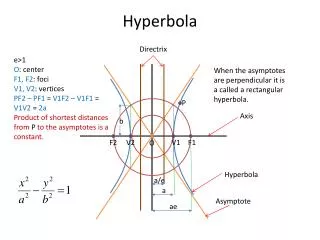
A hyperbola is the collection of points in the plane whose difference of distances from two fixed points, called the foci, is a constant. P (x,y) |dPF1 – dPF2|= 2a
Curves open sideways: Horizontal Transverse axis • The x-axiscontains: • 2 vertices, (-a, 0)and (a, 0) • 2 foci at (-c, 0), (c, 0) • has length = 2a • * the conjugate axis (y-axis) has length = 2b F(c, 0) F(-c, 0) For every point P on the hyperbola we have |dPF1 – dPF2|= 2a
Curves open up/down:VerticalTransverse axis. • The y-axiscontains: • 2 vertices, (0, -b) and (0, b) • 2 foci at (0, -c), (0, c) • has length = 2b • * the conjugate axis (x-axis) has length = 2a F(0, c) (0, b) (0, -b) F(0, -c) For every point P on the hyperbola we have |dPF1 – dPF2|= 2b
GraphingHyperbolas Step 1: Make a rectangle measuring 2a by 2band draw the diagonals. These are the asymptotes. Step 2: Plot the vertices on the transverse axis and draw the arches of the hyperbola b c a a b
Example 1 Graph the hyperbola 4x2 – 16y2 = 64,and find the focal distance. 4x2 – 16y2 = 6464 64 64 That means a = 4and b = 2 c2=a2+b2 c2=16+4 c2 = 20 c= ±√20 Focal distance is 2√20 (0, 2) (–4,0) (4, 0) (0,-2)
Example 2: Write an equation of the hyperbola centered at (0,0) whose foci are (0, –6) and (0, 6) and whose vertices are (0, –4) and (0, 4). b= 4andc = 6 c2=a2+b2 62 =a2+42 36 = 16 + a2 20 = a2 (0, 6) (0, 4) (0, –4) (0, –6)
Example 3: Determine the inequality of the shaded hyperbolic region with vertex (0,12) and focus (0,15). b= 12 and c = 15 c2=a2+b2 225=a2 +144 81 = a2
Example 4: Determine the inequality of the hyperbola representing the shaded region. Slope of asymptote is y = bx a Slope of asymptote:-4-0 = 4 -3-0 3 so b = 4 a 3 b = 4 6 3 b = 8
Example 5: Determine the intersection point(s), if any, of the line 2x – y + 1 = 0 and the hyperbola