Download
1 / 29
290 likes | 411 Vues
Modeling Factors that Influence Firm Performance of Eastern Hardwood Lumber Manufacturers. Brian Perkins September 15, 2014. Why study hardwood lumber business performance?. Business Performance. Given that hardwood mills are: Privately held Highly competitive

E N D
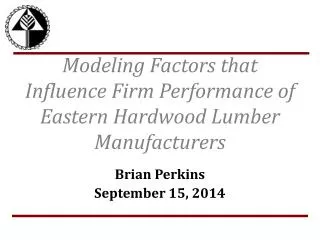
Modeling Factors that Influence Firm Performance of Eastern Hardwood Lumber Manufacturers Brian Perkins September 15, 2014
Business Performance Given that hardwood mills are: • Privately held • Highly competitive How can we measure business performance? • Reliably • Confidentially • Quickly Performance Indicator!
Theoretical Development H1: Firms with a focus or differentiation strategy perform better than firms with a cost leadership strategy. H2: The hardwood lumber industry has shifted towards a differentiation and focus strategy from a cost leadership strategy. H3: More Southern hardwood lumber producers have a cost leadership strategy than a focus or differentiation strategy. H4: More Northern and Appalachian hardwood lumber producers have a focus or differentiation strategy than a cost leadership strategy. H5: Hardwood lumber producers who are geographically diversified perform better than those firms who have geographically limited operations. H6: Hardwood lumber producers who utilize advanced production technology perform better than firms who do not utilize advanced production technology. H7: Hardwood lumber producers who utilize advanced information technology perform better than firms who do not utilize advanced information technology. H8: Product diversification is positively related to performance of hardwood lumber producers. H9: Customer diversification is positively related to performance of hardwood lumber producers. H10: Promotion diversification is positively related to performance of hardwood lumber producers. H11: Vertically integrated firms perform better than non-vertically integrated firms.
Objectives • Develop multiple measures of firm performance for eastern hardwood lumber manufacturers. • Determine the influence of firm-controlled factors on the firm performance of eastern hardwood lumber manufacturers. • Determine the current marketing tactics and strategy of eastern hardwood lumber manufacturers.
Methods Phone interviews – open ended questions Fax survey – 10% of sample Performance indicator development Mail survey - Appendix 3 questionnaire mailings 2 postcard mailings 4 month data collection period
Methods Sampling Strategy 1100+ NHLA members 500+ randomly selected non-members Questionnaire Personalized cover letter Tailored design method Used measures from previous research Sensitive info towards end of questionnaire
Methods Statistical Techniques ANOVA & t-test for comparing means between groups Cluster analysis used to identify groups Factor & correspondence analysis to reduce data Linear regression used to identify relationships Chi² test of independence used to compares null & observed frequencies Z-test used to compare proportions
Results Performance Indicator
Performance Index Distribution 35 StDv = 6.64 Average Kurtosis = -0.190 Skewnesses = 0.010 30 25 20 Frequency 15 10 5 0 27 29 32 34 36 39 41 44 46 48 51 53 55 58 58+ Results
Results Response Summary
Std. Integration Level Performance Mean N Deviation Mean Differences* Backward A 47.7 18 7.39 Backward & A Forward 47 18 7.42 Forward B 43.9 60 6.36 Not Integrated B 43.7 101 6.78 * Means with same letter are not significantly different. LSD (alpha 0.05) Results Organizational Factor
Performance Std. Region Mean N Deviation p-value Appalachian 45.2 107 6.66 Northern 43.8 60 6.26 43.4 24 8.65 Southern 0.322 Results Geographic Factor
Production Technology Performance Std. Level Mean N Deviation p-value High 48.1 18 6.12 44.1 179 6.84 Low 0.02 Results Production Technology Factor
Results Information Technology Factor
Results Marketing Diversification Factor
Calculated Strategy Bush Proportion Current P roportion z - value p - value None 0.25 0 4.7610 < 0.0 1 Differentiation 0.22 0.426 - 3.3629 <0.01 Cost Leadership 0.324 0.22 1.6275 0.10 Cost Leadership & Differentiation 0.206 0.231 - 0.4353 0.66 Focus 0 0.123 - 5.2830 <0.01 Results Change in Strategy
Calculated Production Technology Bowe Proportion Current Proportion z - value p - value Bucking Optimizer 0.05 0.036 0.4738 0.64 <0.01 Headrig Optimizer 0.271 0.49 - 3.3950 <0. 01 Edger Optimizer 0.101 0.26 - 3.3139 Trimmer Optimizer 0.045 0.132 - 2.5034 0.01 Automated Sort Bins 0.071 0.122 - 1.3132 0.19 Results Change in Technology
Conclusions • To improve performance firms should: • vertically integrate, • diversify promotions, • adopt all three optimizing production technologies, • adopt information technology, • adjust their marketing mix and business strategy to fit the markets they serve and the forest resources that are available.
Acknowledgements • USDA Forest Service, Northeastern Area, WERC for funding this project Questions?