Download
1 / 16
160 likes | 300 Vues
AMERU African Micro Economic Research Unit. Comparability of NSC mathematics scores and former SC HG mathematics scores:. How consistent is the signal across time?. AMERU. School leaving examination scores signal the University as to applicants’:. academic potential.

E N D
AMERU African Micro Economic Research Unit Comparability of NSC mathematics scores and former SC HG mathematics scores: How consistent is the signal across time?
AMERU School leaving examination scoressignal the University as to applicants’: • academic potential. • skills set – particularly in language based and quantitative areas of study. • preparedness for tertiary level education.
AMERU The Conversion KeyHigher Grade SC to NSC Source: Wits Admission Office, 2008
AMERU Observed Pass rates 2006 - 2010
AMERU Research indicates that NSC mathematics may be inflated by 20% in the lower ranges • Nel and Kirsten (2009) Stellenbosch University access test used as a benchmark • Schoër et al (2010) Witwatersrand Standardised pre-test and Economics I Test 1 used to convert NSC scores to HG SC scores
AMERU SC HG 2006 vs NSC 2009 and 2010 • Standard of NSC matric maths paper changed from 2009 to 2010 (Parliamentary Monitoring Group, 2010) • Comparing 2006 cohort to both NSC cohorts controls for specific characteristics. • 2006 wrote HG SC maths in 2005 - embedded in previous curriculum
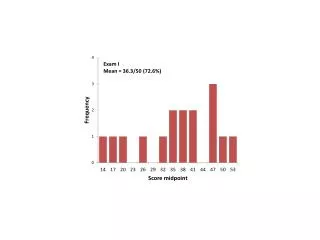
AMERU The Measuring InstrumentComputational Maths I – Test 1 • Computational maths I compulsory for all first year commerce students. • Written three weeks into the semester. • New work based on school work. • Highly correlated with matric maths marks • Test 1 kept standard across the years. • numbers changed but questions the same • test kept confidential • questions re-ordered to promote accessibility
AMERU APPM1004 Test1 comparison: score distribution (2006, 2009, 2010) 20% 15% 2006 10% % of Students 2009 2010 5% 0% <10 <20 <30 <40 <50 <60 <70 <80 <90 <=100 Test1 score (%) Test 1 scores
AMERU Delimiting the data – excluding: • students >21 years • repeating students • foreign students • students who did not write matric in South Africa the year prior to entering University
AMERU Comparing delimited cohorts
AMERU Using propensity score matching to create a more accurate conversion key. • Students matched from 2006 to 2009 & 2010 by: • Test 1 mark • Gender • Race
AMERU HG vs NSC for Propensity Score Matches
AMERU Corrected Conversion Key
AMERU Comparison of deflated scores
AMERU Test 1 score variance by maths score category 2009 2006 2010
AMERU Conclusion • NSC marks generally inflated by 15% - 20%. 20% in lower ranges and 15% in upper ranges. • University courses that rely on a matric maths mark as a signal may consider increasing the required cut off mark. • NSC matric maths scores may be more precise predictors of performance than HG scores of 2006 cohort when deflated.