Download
1 / 15
150 likes | 166 Vues
Explore the middle atmosphere's reaction to solar irradiance fluctuations using the LYRA instrument on PROBA2. This project aims to provide statistical tools for solar irradiance nowcast and forecast and to understand the impact of solar Lyman-alpha emission on the upper atmosphere. By combining modeling tools like SOCOL, events with high irradiance variability will be studied to improve short-term forecasting. The project involves cross-correlating the simulated ensemble mean quantities with solar irradiance data to identify successful forecasting areas. Results from simulation studies indicate potential for successful nowcasting and short-term forecasting, particularly regarding ozone behavior. The study also includes comparisons with observed ozone data to validate the model's predictive capabilities. The presentation concludes with acknowledgments and thanks.

E N D
SCSL SWAP/LYRA workshop Bern 20.-22. June 2006 The response of the middle atmosphere to the solar UV irradiance variability Tatiana Egorova, PMOD/WRC, Switzerland
The project idea: To evaluate the response of the middle atmosphere to the solar irradiancevariability LYRA Instrument on PROBA2 Statistical tools for nowcast and short-term forecast of the solar irradiance (e.g. SOLAR2000) On-line LYRA data for space-weather community Other observations of solar irradiance Chemistry ionosphere climate model (CICM) extension of SOCOL (Egorova et al.,2005) Nowcast and short-term forecast of the neutral and ionic composition of the middle atmosphere
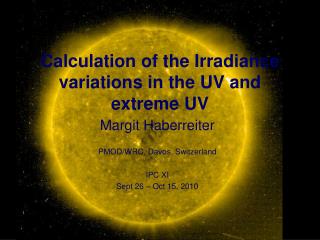
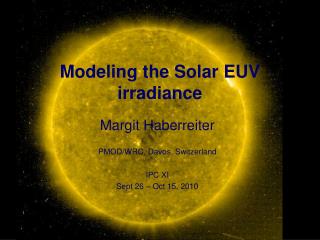
Solar Lyman-alpha emission has a direct impact on the upper terrestrial atmosphere: - it is a source of ionization for the D-region - the major contributor to the dissociation of atmospheric water vapor and other neutral atmospheric constituents in the mesosphere - a direct source of heat for the mesosphere
Study the response of the middle atmosphere: New SUSIM v.22 Ly- 205 nm Events with high variability of Ly- and 205 nm solar irradiance
Modeling tool description SOCOL : modeling tool to study SOlar-Climate-Ozone Links General Circulation component : MA-ECHAM4 (Manzini & McFarlane, 1998) Chemistry/transport component : MEZON(Egorova et al., 2003) + Ionospheric chemistry: 50-80 km, 186 reaction • Winds and temperature • H2O (troposphere) GCM CTM • Ozone • H2O(stratosphere) Horizontal grid ~3.75ºx3.75º(T30); 39 levels in vertical; model top at ~80 km
Study of the middle atmosphere response to the short-term solar irradiance variability: 2003 and 1992 cases study • For a successful now-cast and short-term forecast we need to show that: • the quantity under consideration is sensitive to the solar irradiance variability • the contribution of the dynamical noise is reasonably small • Modeling tool: • chemistry-climate model (CCM) SOCOL (Egorova et al., 2005) • Experiment design: • - input is daily SUSIM spectral solar irradiance • - ensemble run of ten 4-months long simulations for 2003 and ten 1-month long simulations for 1992 with slightly different initial state of the atmosphere • We have compared the obtained time evolution of the simulated species and temperature with available satellite measurements. The obtained results allowed us to define the areas where the nowcast and short-term forecast of the atmospheric species with CCM SOCOL could be successful.
February-May 2003 Ly- 205 nm
February-May 2003, 205 nm Fig.: Maximum of the cross-correlations between simulated ensemble mean quantities and solar irradiance at 205 nm. Thin red line shows the area where the correlation coefficient is statistically significant at 90% level of confidence.
February-May 2003, Ly- Correlation with Ly- will be more pronounced when we will introduce ionosphere in the model.
February - May 2003, 205 nm Fig.: Mean absolute deviation among the ensemble members averaged over 30-day interval: reflects sensitivity of the model results to to the atmospheric state. The non-linear behavior is mostly confined over the northern middle and high latitudes, where the atmospheric dynamics is the most active
Study of the middle atmosphere response : 1992 case study Example Fig.:Deviation of the solar irradiance at 205 nm from its monthly mean for January 1992. SUSIM data Fig.: Zonal mean ozone volume mixing ratio (ppmv) at 50 km averaged over 40oN-50oN from HALOE data (dotted black line) and from the model results. The ensemble mean is shown by solid black line, color lines represent different ensemble members. Despite of some differences all ensemble members reveal an increase of ozone mixing ratio from January 2 to January 7 and a subsequent decrease, which correlate reasonably well with the time evolution of the solar irradiance. The simulated and observed ozone behavior do not coincide completely, but it can be hardly expected because the satellite data have been collected during sunrise and the latitudes of data sampling are slightly different from day to day, while the simulated data represent daily and zonal mean values. However, the similar features are clearly visible in HALOE and simulated ozone, which confirms our conclusions about potentially successful nowcast and short-term forecast of the ozone in this area.
PMOD/WRC, Davos • End of the presentation… • Thank you!!!
Study of the middle atmosphere response : Results of the simulation with SOCOL (i) Cross correlation with flux at 205 nm Areas of higher probability forecast OH O3 OH O3 H2O Tem H2O Tem Fig.: Maximum of the cross-correlations between simulated ensemble mean quantities and solar irradiance at 205 nm. Thin red line shows the area where the correlation coefficient is statistically significant at 90% level of confidence. Fig.: Areas where the now-cast and short-term forecasts of the considered quantities can be carried out with higher probability of the success. The obtained results allowed us to define the areas where the now-cast and short-term forecast of the atmospheric species with CCM SOCOL can be successful.