Download
1 / 31
340 likes | 528 Vues
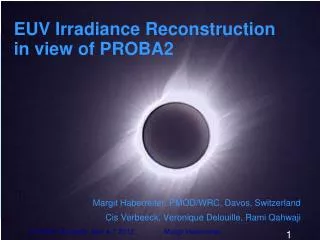
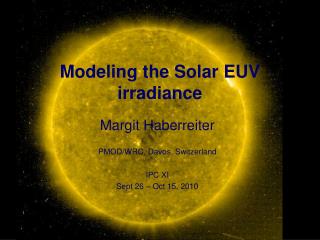
Modeling the Solar EUV irradiance. Margit Haberreiter PMOD/WRC, Davos, Switzerland IPC XI Sept 26 – Oct 15, 2010. Picard. Absorption of EUV in the Earth‘s atmosphere. Altitude-wavelength dependence of energy deposition from solar irradiance units of Log 10 (Wm -4 )

E N D
Modeling the Solar EUV irradiance Margit Haberreiter PMOD/WRC, Davos, Switzerland IPC XI Sept 26 – Oct 15, 2010
Absorption of EUV in the Earth‘s atmosphere Altitude-wavelength dependence of energy deposition from solar irradiance units of Log10(Wm-4) From Solomon and Qian 2005 Solar minimum conditions EUV varies by a factor of 2 and more!!
Peculiar Minimum 23/24 Claus Froehlich, PMOD TSI composite
Is there an EUV long-term trend? The SOHO/SEM measurements (36-34 nm) indicate adecrease in the EUV by15% Uncertainty ~ 6% Not explained by F10.7 or sunspot number What is the role of coronal holes? 15% decrease Solomon et al, 2010, GRL, 37, L16103
EUV spectrum • Wavelengths • UV: 120 – 400 nm • EUV: 10 – 120 nm • Contribution from the • Chromophere • Transition region • Corona
Solar Modeling (SolMod) Multi level atoms 373 ions, from H to Ni with ioncharge 25 ~14’000 atomic levels ~170’000 spectral lines Statistical equation is solved to get the level populations Chromosphere and transition region for ioncharge 2: full NLTE (Fontenla et al., 2006; 2007; 2009) plus optically thin transition region lines Spherical symmetry Corona ioncharge >2 optically thin, i.e. collisions and spontaneous emission Line of sight integration accounts for opacity Spherical symmetry
Masks from Precision Solar Photometric Telescope Continuum, 607 nm (PICARD) Disk mask on 2005/9/12 obtained from PSPT data, Mauna Loa, Hawaii http://lasp.colorado.edu/pspt_access/ (R) Sunspot Penumbra (S) Sunspot Umbra (P) Faculae (H) Plage (F) Active network (D) Quiet network (white) (B) Intergranular Cells • Determined by the contrast as a • function of the position on the disk • Only possible with respect to a • normalized quiet Sun intensity Ca II 393.4, FWHM=0.27nm
Solar Chromosphere (Ca II) of quiet Sun s Active Network Model F Intergranular Cells Model B Quiet Network Model D Fontenla et al., 2009, ApJ
Faculae Plage Active network Quiet network Intergranular Cells Fontenla et al., 2009, ApJ 707, 482-502
G-Band of CH molecular lines Fontenla et al., 2009, ApJ 707, 482-502
Violet CN Band Fontenla et al., 2009, ApJ 707, 482-502
Coronal models • Coronal Models are based on temperature and densities given by • Doschek (1997), ApJ, 476, 903 • Singh et al., 1982, J. Astrophys. 3, 249 • Cranmer et al, 2007, ApJS 171, 520
Spherical Symmetry Allows the calculation of intensities at and beyond the limb (e.g. Haberreiter et al. 2008) Account for corona over 2 x area of solar disk Adopted from Mihalas, 1978
Optical depth • Fe XV 17.1 nm: • Disk center: max = 0.06 • Limb: (r=1.02): max = 0.63 (~900,000K) • Fe XV 19.5 nm: • Disk center: max = 0.06 • Limb: (r=1.02): max = 0.34 (~1,100,000K) • Fe XV 28.4 nm: • Disk center: max = 0.39 • Limb: (r=1.02): max = 0.88 (~2,000,000K)
EUV spectrum Haberreiter, 2010, submitted to Solar Physics EVE rocket calibration flight: Chamberlin et al., 2009, GRL
EUV spectrum Haberreiter, 2010, submitted to Solar Physics EVE rocket calibration flight: Chamberlin et al., 2009, GRL
SOHO/EIT images Fe IX 17.1 nm He II 30.4 nm Fe XV 28.4 nm Fe XII 19.5 nm
EIT passbands Fe IX 17.1 nm Fe XII 19.5 nm Fe XV 28.4 nm He II 30.4 nm
EIT wavelengths SRPM EVE
Variability of solar activity features EIT 19.5 nm 10/01/2002 EIT 17.1nm 07/01/2005 EIT 30.4 nm 07/10/2006 EIT 28.4 nm 10/10/2003 coronal holes – quiet Sun – quiet coronal network – active coronal network - hot loop – super hot loop
EIT image analysis • Radial dependence for outer corona • Thresholds based on intenstiy histogram of the EIT images • Maximum value of histogram varies with solar cycle (in particular for 284 Ǻ) • Does the coronal hole/quiet Sun intensity changes with solar cycle → identification of coroanl features not trivial
Does the quiet Sun intensity change Barra et al, 2009 already performed the analysis for 3 components.
Outlook: Shape of coronal holes influences strength of solar wind streams Gibson et al, 2009
Conclusions • Good agreement between the synthetic spectra and the observed EVE quiet Sun spectrum • Our calculations indicate that opacity effects have to be taken into account for some prominent lines, i.e. the EIT lines • Challenge for feature identification: potential change of coronal hole and quiet Sun intensity • Spectral reconstruction over a full solar cycle still to come....
Further plans • Valicate the identification scheme of coronal holes, active regions • Account for temporal variability • changing distribution of features, e.g. coronal holes, active regions • LYRA measurements very important for validation/comparison • 1 TB/day from SDO/AIA and SDO/EVE ....
References • Cranmer et al, 2007, Self-consistent Coronal Heating and Solar Wind Acceleration from Anisotropic Magnetohydrodynamic Turbulence, ApJS 171, 520 • Doschek (1997), Emission Mesaures and Electron Densities for the solar transition region, ApJ, 476, 903. • Fontenla et al., 2009, Semi-empirical Models of the Solar AtmosphereIII. Set of NLTE Models for FUV/EUV Irradiance Computation, ApJ, accepted for publication • Klimchuk (2006), On Solving the Coronal Heating Problem, Solar Physics 234, 41-77 • Singh et al., 1982, Eclipse Observations of Coronal Emission Lines, J. Astrophys. 3, 249