Download
1 / 29
300 likes | 322 Vues
Investigate likelihood of damage in flexurally dominant RC columns at specified deformations. Research approach involves analyzing key damage levels, deformation parameters, and establishing a comprehensive test results database. Study onset of spalling, bar buckling, and loss of axial load. Correlate damage with various deformation parameters like drift ratio and plastic rotation. Explore typical progression of damage demand parameters. Utilize PEER Column Performance Database for insights. Correlate measured deformations with observed damage for accurate evaluation. Scrutinize effects of cycling, force-deformation responses, and observer subjectivity. Conclude on the importance of the database in model accuracy assessment.

E N D
Limit States and Design Parameters for Flexurally Dominated RC Columns Marc O. Eberhard Myles Parrish, Mike Berry University of Washington
Objective • P[DM|EDP] • For a specified deformation, what is the likelihood that a flexurally dominant reinforced column will suffer a particular level of damage?
Research Approach • Identify Key Levels of Damage • Consequences • Identify Promising Deformation Parameters • Accuracy, Generality, Reproducibility • Assemble Database of Test Results • Correlate Damage with Deformation Parameters
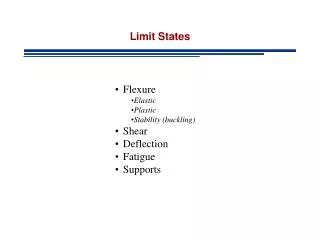
Onset of Spalling Onset of Bar Buckling Loss of Axial Load Typical Progression of Damage
Demand Parameters Deformation Controlled Peak Deformation • Drift Ratio • Plastic Rotation • Displacement Ductility • Maximum Compressive Strain • Maximum Tensile Strain
Typical F Spiral-Reinforced Columns Rectangular Columns (149 tests) (204 tests) Properties Table Properties Table Test Results Test Results References References Columns with Splices RetrofittedColumns (7 tests) (11 tests) Properties Table Properties Table Test Results Test Results References References PEER Column Performance Database http://ce.washington.edu/~peera1
Typical Force-Displacement History 75 50 25 Applied Force (kips) 0 -25 -50 -75 -3 -2 -1 0 1 2 3 Displacement (in.) Nelson and Price, 2000 (P3)
75 SP BB 50 AX 25 Applied Force (kips) 0 -25 -50 -75 -3 -2 -1 0 1 2 3 Displacement (in.) Nelson and Price, 2000 (P3)
Correlate Deformation Measures and Observed Damage:Onset of Spalling
Why So Much Scatter?? • Observer Subjectivity • Discrete Levels of Imposed Deformation • Model Inaccuracy • complicated phenomena • effects of cycling • force-deformation response
Kmeas/Kcalc 2.0 0 < L/D < 3 3 < L/D < 8 1.5 MEAN 1.0 0.5 0.0 HOGN KP MAND SAAT (P/f'cAg < 0.35)
60% 40% 20% 0% Kmeas/Kcalc COV HOGN KP MAND SAAT (P/f'cAg < 0.35)
Correlate Deformation Measures and Observed Damage:Onset of Bar Buckling
Drift Ratio at Onset Bar Buckling Rectangular Reinforced
Drift Ratio at Onset Bar Buckling Rectangular Reinforced
Drift Ratio at Onset Bar Buckling DRbuckle (%)= 2.5 (1-P/Agf’c)(1+8sfy/f’c) Rectangular Reinforced
buckle = 0.015+0.02sfy/f’c Strain at Onset of Bar Buckling
Conclusions • Database provides the information needed to systematically evaluate the accuracy of force-displacement and damage models. • For a given level of deformation, one can estimate the likelihood of reaching a particular level of damage.