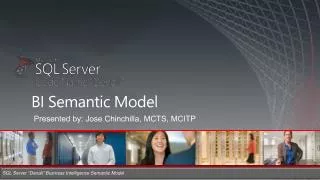
Business Intelligence Semantic Model
Business Intelligence Semantic Model. Tomislav Piasevoli. SoftPro Tetral d.o.o. Contents. What is BISM? PowerPivot SQL Server „Denali” The significance of BISM Guidelines. Prerequisites. interest in BI curiosity . Few questions to start with. how many of you worked in PowerPivot?


Business Intelligence Semantic Model
E N D
Presentation Transcript
Business Intelligence Semantic Model Tomislav Piasevoli SoftPro Tetral d.o.o.
Contents What is BISM? PowerPivot SQL Server „Denali” The significance of BISM Guidelines
Prerequisites interest in BI curiosity
Few questions to start with ... • how many of you worked in PowerPivot? • how many used PowerPivot on SharePoint? • how many of you has experience in building cubes? • how many used cubes for reporting?
1 What is BISM?
Analytical systems • turn data into information • goals of their architecture • optimize access to source data • prepare the data for analysis
I – Optimize access to source data • store the data in structures suitable for analysis and ad-hoc querying or leave them „as is“ on the source • requirements • good performance • flexibility • scalability • ... • which technology to choose/use?
MOLAP, ROLAP, HOLAP • row-based databases • MOLAP = multidimensional • ROLAP = relational • HOLAP = hybrid (only for measure groups = facts) • performance based on aggregations • partitioning • compression (MOLAP) • not limited by available memory
II – Prepare the data for analysis • enable the data analysis like there’s only one source of data • actually, there can be many various data sources • relational databases • Excel files • text files • RSS feeds, ... • where to perform the join of the distributed systems? • provide the interpretation (business meaning) to data • how to make it comprehendable to the end users?
Semantic data model • a metadata layer (on top of the data) • describes concepts (entities) and connections (relations) between them • user-oriented • shows what the tables and relations represent in the real world semantics = the study of meaning
UDM • existing semantic model for BI • came with SQL Server 2005 • enables connecting data from various sources • add relations between tables • add calculations • in tables – calculated columns in DSV (T-SQL) • over the model – MDX script (MDX) • calculations cannot be combined (different languages!) or it’s very hard to do so
SQL Server 2005 Analysis Services MDX MDX MDX MDX MDX
SQL Server 2008 Analysis Services MDX MDX MDX MDX
SQL Server 2008 R2 Analysis Services MDX MDX MDX MDX
2 PowerPivot
PowerPivot • SQL Server 2008 R2 Analysis Services as an integrated version • covers personal and team BI segments
SharePoint 2010 Integration Excel 2010 free add-in for Excel 2010 (www.powerpivot.com) comes as 32-bit and 64-bit application comes with SQL Server 2008 R2 x64 during the installation, you choose SQL Server PowerPivot for SharePoint
VertiPaq in-memory column-based database very high data compression scales linearly with the number of cores doesn’t require the process of designing and building aggregations and other tunning envisioned to support partitioning and paging on large data sizes (although it doesn’t do that in PowerPivot)
BISM v1 • the new semantic model for BI • came with SQL Server 2008 R2 (for PowerPivot!) • enables connecting data from various data sources • add relations between tables • add calculations, two places: • in tables – calculated columns (DAX) • over the whole model – calculated measures (DAX) • calculations can be combined (same language)
BISM v1 • the result of merging todays analytical (UDM = SSAS) and reporting (SDML = SSRS) semantic data model with the goal that it integrates (in due time) • reporting, analysis, dashboards and scorecards • personal, team and corporate BI segments • works in cached (VertiPaq) mode
DEMO BISM v1 in SQL Server 2008 R2
Short contents of the demo • PowerPivot is an arhived SSAS database • DAX functions are hidden among MDX functions • SharePoint controls with the BISM instance of SSAS • the existance of new DMVs for BISM instance on SharePoint • BISM models support MDX • SQL Profiler VertiPaq SE events
3 SQL Server „DENALI”
BISM v2 • one model for all • reporting, analysis, dashboards, scorecards • personal, team, corporate BI • has a relational and multidimensional API • it was announced that it will eventually support both cached (VertiPaq) and the pass-through* (realtime) mode * only SQL Server data sources for now
Pass-through no additional database data stays as is in the original structures ideal for the realtime analysis
Analysis Services „Denali” - UDM MDX MDX MDX ? MDX MDX
Analysis Services „Denali” - BISM MDX MDX ? DAX MDX DAX MDX DAX
Announced improvements of BISM* • hierarchies, KPIs, parent-child, drillthrough, perspectives • additional DAX functions (RankX, DistinctCount, GroupBy, Lookup, ...) • security (role-based with Active Directory, column/row based) * doesn’t mean that „Denali“ will actually have these exact features
What BISM in „Denali” won’t have? • some of the UDM features • scripts, actions, translations, role-playing dimensions • object model • write-back • other • realtime for non-SQL Server data sources • MDX query support for realtime
UDM improvements in „Denali” • mostly outside of GUI • no more 4GB string store limit • better support for PowerShell • better monitoring (XEvents) • various engine optimizations • the goal is to make the SSAS (UDM instance) more scalable
4 The Significance of BISM
Advantages of BISM relatively simple model (no cubes, dimensions, measures, ...) fast response no matter the granularity of query flexible (every column is also a measure and an attribute) DAX calculations are similar to Excel formulas relational model and result format is more understandable and user-friendly to majority of people
Scalability Excel SharePoint „Denali”
Other advantages of BISM • faster development than in UDM • prototyping by end-users • they know the best what they want from the data and what the data means (semantic!) • easier changes of model • reduction of cost in developing the full BI solution
New possibilities in data modeling • Highlights from various blogs • Marco Russo – ad-hoc joins, ETL? • Thomas Ivarsson – master-detail design • Alberto Ferrari – point-in-time, SCD-2, rank
5 Guidelines
Positioning the BISM Scalability* source: Thomas Kejser, SQLCAT ROLAP ColumnStore 50 TB Scalability= - good support for concurrent queries - not dependent on available memory - good maintainability 5 TB MOLAP 100 GB BISM 2 GB PowerPivot Usability