Traffic Concepts and Analysis Course
Explore traffic flow theories, congestion prediction, and traffic modeling concepts in this interactive course. Understand key concepts like flow, speed, density, and spacing in traffic analysis. Learn how to measure and predict traffic patterns effectively.

Traffic Concepts and Analysis Course
E N D
Presentation Transcript
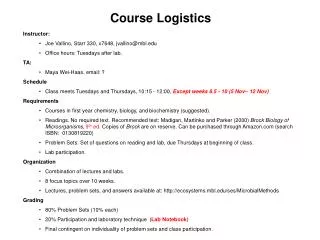
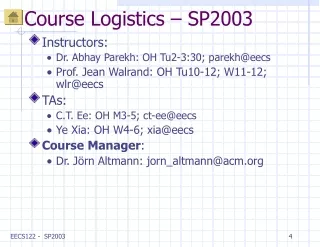
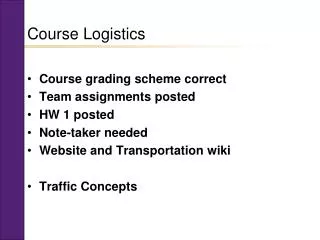
Course Logistics • Course grading scheme correct • Team assignments posted • HW 1 posted • Note-taker needed • Website and Transportation wiki • Traffic Concepts
Traffic questions • Have you ever driven out of a traffic jam only to find that nothing was apparently causing it? • Why does stop and go traffic happen? • Why does traffic slow down as it gets heavier? • How do we predict congestion?
Traffic Concepts CEE 320Anne Goodchild
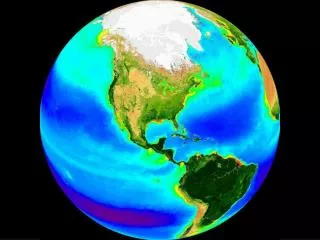
How can we describe traffic? • Consider one lane of traffic • Traffic is constantly changing
How would you model traffic flow? • As a liquid? • As a glacier? • Discrete event simulation? • …
Concepts • Flow • Speed • Density
Flow (q) • The number of vehicles (n) passing some designated roadway point in a given time interval (t) • Units typically vehicles/hour • Volume typically refers to flow in an hour
Flow • Text also uses flow rate • Flow is constantly varying! • Analysis flow rate is peak 15-minute flow within the hour of interest.
How much space do you leave between vehicles? • 2 chevrons! • Depends on speed • Varies for each person
Spacing • The distance (ft) between successive vehicles in a traffic stream, as measured from front bumper to front bumper
Spacing • Density • the number of vehicles over a length of freeway • Occupancy • Measured by loop detectors • The percent of time the loop is covered by a vehicle
Headway (h) • The time (in seconds) between successive vehicles, as their front bumpers pass a given point.
Headway From HCM 2000
How do we measure average speed? • The average speed of vehicles that pass by a specific point in space over a specific time period (TMS). • Time necessary for a vehicle to travel a length of roadway (SMS).
Measuring Speed • Time mean speed • Taken at a specific point • Average of instantaneous speeds • Space mean speed (u) • Harmonic speed • Look at a segment of roadway • Average speed of all vehicles in that segment
Time Mean Speed • Arithmetic mean of speeds observed at some point • Easy to measure radar
Space Mean Speed • It is the harmonic mean • Used in traffic models, but harder to measure
Example • You are in a vehicle traveling a total of 10 miles. • the first 5 miles you travel at 40 mph • the next 5 miles you travel at exactly 60 mph • What is your average speed over the time you spent traveling that 10 miles? • What is your average speed over that distance?
Average speed over time and average speed over distance are different 10 miles 40 mph 60 mph 5 minutes 7.5 minutes 12.5 minutes 7.5 minutes 5 minutes
Example time • You are in a vehicle traveling a total of 10 miles. • the first 5 miles you travel at 40 mph • the next 5 miles you travel at exactly 60 mph • What is your average speed over the time you spent traveling that 10 miles? • 5 miles at 40 mph = 7.5 minutes • 5 miles at 60 mph = 5 minutes • weighted average = (40(7.5) + 60(5))/(7.5 + 5) = 48 mph
Example - distance • 5 vehicles over a given 1 mile section take 1.0, 1.2, 1.5, 0.75 and 1.0 minutes respectively • Average travel time • 5.45/5 = 1.09 minutes = 0.0182 hours • Therefore, average speed over that distance 1 mile/0.0182 hours = 55.05 mph
The number of vehicles (n) occupying a given length (l) of a lane or roadway at a particular instant Unit of density is vehicles per mile (vpm). Density (k - konzentration)
Number of vehicles in length of segment Inverse of average spacing Density (k)
A model for the relationship between flow, density, and speed Represents idealized behavior and fundamental relationships Useful for traffic analysis Traffic Flow Theory
Complete the charts speed flow density density
Complete the charts speed flow
Speed vs. Density ufFree Flow Speed Speed (mph) kjJam Density Density (veh/mile)
Additional definitions • Free-flow speed (uf) • The speed at which vehicles will travel unimpeded • Jam density (kj) • The density of vehicles in stopped traffic • Capacity (qm) • The maximum flow a section of roadway can maintain
Flow vs. Density Congested Flow Highest flow, capacity, qm FLow (veh/hr) kmOptimal density kjJam Density Uncongested Flow Density (veh/mile)
Speed vs. Flow ufFree Flow Speed Uncongested Flow um Speed (mph) Highest flow, capacity, qm Congested Flow Flow (veh/hr) qm is bottleneck discharge rate
Measurement • Density can easily be measured by remote sensing, but has historically been difficult to measure • Use occupancy obtained from loop-detectors • TMS more easy to measure than SMS • Use correction or approximation • Easy to measure with remote sensing (GPS) • Flow is easy to measure • Occupancy is measure of density • Only need to measure 2 of 3
Loop Detector Freeway Monitoring
Inductance Loop Detectors Loop inductance decreases when a car is on top of it. Inductance T = ton 0 ton T = toff toff Time
Inductance High low Tn tn1 tn2 tn3 Tn+1 Time Inductance Loop Detectors • Single loops can measure: • Occupancy (O): % of time loop is occupied per interval • Volume (N): vehicles per interval Single loop measurements?
How do you estimate speed from a single loop detector? • You know how long it took the object to pass over the detector • You know the percent of time (in a short interval) the loop was covered by a vehicle • What else do you need to know?
Can We Get Speed from a Single Loop? EVL ~ vehicle length + detector length (24 feet)
Estimating Speed from a Single Loop? • Using typical traffic data 100 converts percent to decimal
What speed is this? • TMS