Download
1 / 15
150 likes | 151 Vues
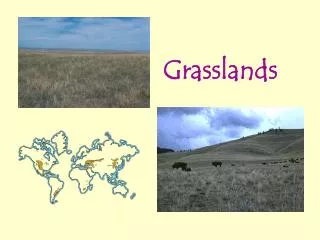
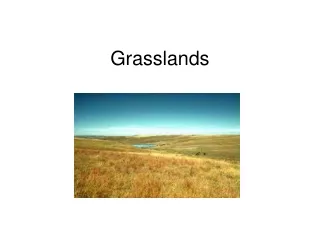
Plant rooting depths and Precipitation - a study across grasslands. Catarina F. Moura Sta242/Env255 Spring 2001. Introduction.

E N D
Plant rooting depths and Precipitation- a study across grasslands Catarina F. Moura Sta242/Env255 Spring 2001
Introduction “Just as there is a quiet bias in maps of the world that consistently present the northern hemisphere “on top”, our perception of plants would change if plants were drawn upside down- roots on top and shoots underneath” (Jackson et al. 1999) Roots are important for anchoring plants, for uptake of resources (water and nutrients) and storage of those resources; Plants tend to grow roots in direction of resources-rich zones (eg. More water available); General patterns in roots distribution have been observed for different biomes and plant functional types; Roots plasticity is an important factor of drought adaptation of plants;
Objectives • Can climatic variables partially explain the maximal rooting depth of plants in grasslands? • Is there a pattern along a precipitation gradient? • If so, is this influence observed after other variables are taking in account? • Which other variables play a role in explaining differences between plant root’s depth?
Data description • Data was collected from literature with information on plant’s roots of grasslands all over the world (number of species recorded= 408) • Environmental factors: • MAP (mean annual precipitation in mm) • PET (mean annual potential evapotranspiration in mm) • S (seasonality or precipitation regime): All year, Winter, Summer or Tropical • T (Soil texture): 6 categories from clay to sand • Plant traits: • D (Root maximum depth in m) • AP (Life span): Annual or Perennial • GF (Growth form): Cespitose (CG), Rhizomatous (RG), AG (annual grass), G (variable) • PS (Photosynthetic mechanism): C3 or C4
E.D.A.: Data summary The distributions of the three variables are positively skewed and presented several extreme values. Log transformation was used for depth (varying from 0.10 to 6 m) in order to better suit the normality assumption. MAP ranged from 20 to 2200 mm and PET from 550 to 2300mm. No transformations were used for MAP and PET. Fig.1-Box-plots for Depth (original and log scale)
E.D.A.: graphical relationships Graphs based on a subset of the data, used for subsequent analysis, containing no missing values (n=242). Log-transformed response variable: clearer relationship with predictors, less extreme values. No considerable improvement by using transformations of the explanatory variables Fig.2-Scatterplots for Depth vs. MAP or PET and log Depth vs. MAP or PET
Statistical analysis I • Which variables best explain the rooting depth of a plant? • Automatic model selection techniques based on BIC and Cp criteria suggested the the following model (Cp=4.7,BIC=-40.89): * The model had both the lowest Cp and BIC (0.2255) (0.0007) (0.1771) (0.2551) (0.1856) (0.0837) (6.25*10-7) Estimated s = 0.6025 (235 d.f.); r2= 0.2620
Statistical analysis II • Is the association between log D and MAP really non-linear (is MAP2 significant)?Yes, the model should take in account this non-linearity (ESS F-test, p-value=0.0004) • Does soil texture exerts any influence?Adding the categorical variable T improves the model and soil texture seems influential (ESS-F-test, p-value=0.0372) • What is the effect of seasonality after taking in account the previous factors?There is not a significant effect (ESS-F-test, p-value=0.0564). Besides the difference of root depths among the regimes is driven by T (tropical) which includes only 3 data points. • C4 plants are usually common in arid environments. Is there an interaction between MAP and PS?The interaction term was not significant (ESS-F-test, p-value=0.0959) • Both rainfall and soil texture determine the availability of water for plants; is there any important interaction? The interaction term was not significant (t-test, p-value=0.9575)
Model Table II- Regression model of log Depth on MAP, MAP2, GF, PS and T Fig.3 – Predicted Depth values vs. MAP for: a) annual C3 plant (black line) b) annual C4 plant (red line) c) cespitose C3 plant (green line). (soil texture=clay)
Diagnosis/model refinement • Variance of residuals fairly constant • Residuals reasonably normally distributed except for an heavy left tail • Two potential influential points indicated by leverage (hi>0.11) • A few outliers indicated by ext. student residuals (|stu.resi|>2) • Cook’s distance revealed no isolated influential points (all Di<0.06<1). Analyze set of outliers? • Running the regression without the indicated outliers did not change the overall significance of the model (F-test=8.4093, p-value=3.86E-13) and neither the significance of individual coefficients. Therefore, they were not excluded.
Conclusions and biologic interpretations • Mean annual precipitation is related with maximal rooting depth in a non-linear way. This effect is significant after taking in account differences in growth form, photosynthetic mechanism and soil texture (F-test(MAP, MAP2=5.756, p-value=0.00727) • Building deep roots is associated with a cost that must be balanced by benefits. In water-limited environments this trade-off should even be more evident. • Therefore, a plant would benefit from having deeper roots if, in fact, it can get enough water. Probably, within a range of lower MAP the maximal rooting depth will increase with increasing rainfall (MAP). However after a certain “threshold” it would no longer compensate since water will be available at shallow soil layers. • The aridity of an ecosystem is not only related with MAP but also with PET and therefore it would be expected a significant interaction and influence of the two variables. However neither PET nor MAP:PET were significant on the regression models.
For a given amount of MAP and holding all the other factors constant, the median maximal rooting depth is ~30% higher for C4 plants than for C3. The difference is statistically significant since the 95%CI for the coefficient of PS does not include zero (0.0868,0.4328). • Due to the their photosynthetic mechanism, C4 plants are generally considered more efficient in water-use than C3 plants are. This could favor an “easier” allocation of carbon to build deeper roots. • However this could also be explained by different plant sizes. For a better understanding, the effect of aboveground plant characteristics (volume, height, etc) should have been taken into account. Perhaps “root depth/shoot volume” would be a better variable for comparison of different plants.
Soil texture may present a mechanic impediment for root development and also determines the amount of water available. Typically, coarser soils will have less water available in shallower than in deeper layers (considering that all other conditions are the same). • Edaphic factors (soil texture) are associated with the maximal root distribution (F-test=2.726, p-value=0.000945) Although the variable “soil texture” was included in the model (p<0.05), the coefficients for individual soil types were not significant which may be a result of the categories used (too detailed, maybe some bias on delimitations). A better approach would be, perhaps, use a “coarse, medium, fine” definition. Recoding the previous categories (in order to change the reference) seemed an alternative, but did not induce many changes.
Final remarks • Despite the high variability, usual in natural systems and processes, it is possible to partially describe the roots depth distributions within grasslands. The model presented explains 30.6% of that variability. • Because this study was based in data available in the literature and focused only in grasslands, these results must be considered in the right context. This is not a random, controlled experiment, therefore no causal relationship should be infered. Besides it cannot be extrapolated for other biomes and different plant functional types. • Nevertheless, it presents a general pattern based on a large sampling size and a representative geographic variation (eliminating site effects). It is important to understand root function and provide information on plant adaptation and climate change effects.
References • Jackson, RB, WT Pockman, WA Hoffmann. (1999) The structure and function of root systems. In (FI Pugnaire, F Valladares, eds.) Handbook of Functional Plant Ecology.Marcel Dekker, NY, pp. 195-220. • Ramsey, F.L., and D.W. Schafer. 1997. The Statistical Sleuth: A Course in Methods and Data Analysis. Duxbury Press: New York. • Schenk, J. and Jackson, R.- unpublished data Acknowledgments I thank Dr. Rob Jackson and Dr. Jochen Schenk for making available a subset of their database for the purpose of this project.