Download
1 / 26
270 likes | 668 Vues
Use of cure fraction model for the survival analysis of Uterine Cancer patients. Noori Akhtar-Danesh, PhD Alice Lytwyn, MD, FRCPC Laurie Elit, MD, FRCPC McMaster University Hamilton, Canada daneshn@mcmaster.ca. Relative Survival Analysis.

E N D
Use of cure fraction model for the survival analysis of Uterine Cancer patients Noori Akhtar-Danesh, PhD Alice Lytwyn, MD, FRCPC Laurie Elit, MD, FRCPC McMaster University Hamilton, Canada daneshn@mcmaster.ca
Relative Survival Analysis • Relative survival (RS) is defined as the observed survival among cancer patients divided by the expected survival in the general population. • It has become the standard method of analysis for population-based cancer registry datasets (Dickman et al., 2004; Dickman & Adami, 2006). Stata Conference, Chicago 2011
Cure fraction • On the other hand, in population-based cancer studies patients may be classified into those who survive the disease and those who encounter excess mortality risk compared to the general population. • Cure fraction is defined as the proportion of patients who survived the disease and no longer experience the excess mortality rate (Lambert et al., 2007). Stata Conference, Chicago 2011
Cure fraction • The cure fraction estimates the proportion of cancer patients who are statistically cured (rather than medically cured), i.e. they experience the same rate of mortality as the general population. • Therefore, it assumes that a proportion of the cancer patients, , will be statistically cured and the other proportion, 1-, will experience excess mortality rate. Stata Conference, Chicago 2011
The concept of relative survival- Cumulative survival Stata Conference, Chicago 2011 By courtesy of Mats Talbäck
Cure fraction • In this approach there is no need to know the actual cause of death. • Indeed, it includes all causes of death whether or not it is directly or indirectly associated with the diagnosis of cancer (Ederer, Axtell, & Cutler, 1961). Stata Conference, Chicago 2011
Cure fraction model • To use a cure fraction model, the background mortality rate for the general population needs to be incorporated in the model. • We used a cure fraction model to estimate both the cure fraction rate and the relative survival for patients diagnosed with uterine cancer in Canada over the period of 1992-2005. Stata Conference, Chicago 2011
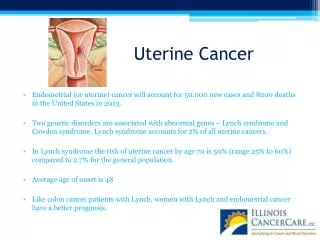
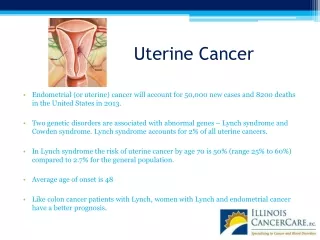
Uterine cancer • Uterine cancer is the most common type of gynaecological cancer. • The Canadian Cancer Society estimates that cancer of the body of the uterus affects about 4500 women across Canada annually and about 790 women are expected to die each year (2010) . Stata Conference, Chicago 2011
Objectives • To estimate effects of age and geographical region on the survival of uterine cancer patients. • To estimate long-term trends in the survival of uterine cancer patients in Canada. Stata Conference, Chicago 2011
Methods Statistical Analysis • We used a non-mixture cure fraction model with Weibull distribution for relative survival analysis. • We used restricted cubic splines with 5 knots to model the effects of year of diagnosis which provides more flexibility to model non-linear trends (Durrleman & Simon, 1989). • Then, we predicted the cure fraction rate and median survival for each age group based on the year of diagnosis. Stata Conference, Chicago 2011
MethodsInclusion criteria • Women were included if they: • had an new diagnosis of uterine cancer from 1992- 2005 • were between 16-79 years of age at the time of diagnosis. • The age range of 16-79 years was selected to include women who were in or had completed their reproductive age. • Follow-up information was retained until the end of 2006. Stata Conference, Chicago 2011
MethodsExclusion criteria • Women were excluded if they were 80 years or older because the cure fraction model is less reliable for this age group (Lambert et al., 2007). • Patients were also excluded if the diagnosis was only based on the death certificate or autopsy. • Data from the province of Quebec were also excluded because the death could not be confirmed by CCR. Stata Conference, Chicago 2011
Methods • For the analysis by age, women were grouped into strata given their age at diagnosis (16- 39, 40- 49, 50- 59, 60- 69, and 70- 79). • Because health care in Canada is funded by the province, women were grouped based on the province. Stata Conference, Chicago 2011
Methods • Due to small sample sizes provinces were collapsed into geographically cohesive regions as: • British Columbia, • Central-west and Northern Canada: Alberta, Saskatchewan, Manitoba, Yukon, Nunavut, Northwest Territories, • Ontario, • Eastern Canada: New Brunswick, Nova Scotia, Prince Edward Island and Newfoundland. Stata Conference, Chicago 2011
Results • A total of 32,485 women were identified with uterine cancer. • Mean age at diagnosis= 61.5 (SD=10.7) year • Median age at diagnosis= 62 year. • 87.0% of them were 50+ years old. • Over half of the uterine cancer cases were diagnosed in Ontario. Stata Conference, Chicago 2011
Results • The highest rate of death (26.4%) was noted in Eastern Canada compared to: • Ontario (24.6%), • British Columbia (23.0%; the lowest rate), • and Central-West & Northern Canada (23.5%). • In total 7880 patients (24.3%) diagnosed with uterine cancer died by the end of 2006. Stata Conference, Chicago 2011
Cure Fraction Model The cure fraction is identified by the portion of the curve that plateaus over time. Stata Conference, Chicago 2011
Cure Fraction Model Stata Conference, Chicago 2011
Cure Fraction Model Stata Conference, Chicago 2011
Cure Fraction Model Stata Conference, Chicago 2011
Discussion • We found that cure fraction rate is highly dependent on the age of diagnosis. • This may in part be related to: • higher rate of co-morbidities in older women, • earlier diagnosis of uterine cancer in younger women because of indicators such as changes in menstrual cycle • increased self awareness (i.e., body image). Stata Conference, Chicago 2011
Discussion • Over the period of 1992-2006 there has been a general drift toward improving median survival time over all age groups. • This analysis indicates that both cure fraction rate and median survival have slightly improved over the this period. Stata Conference, Chicago 2011
Discussion • This change may reflect access to better diagnostic techniques to: • define at risk for uterine cancer and thus down staging, • improved anaesthesiology and postoperative care, • improved therapies for uterine cancer, • access to several lines of adjuvant chemotherapy and biologic agents, • and access to palliative care. Stata Conference, Chicago 2011
Limitations & Strengths • One potential limitation of the cure fraction model is that it estimates a cured proportion even when statistical cure is not reached. • We can estimate survival for the uncured group which provides more insight to the survival pattern of uncured patients. Stata Conference, Chicago 2011
Alternative approach • Flexible parametric model (stpm2 code for Stata) which introduces more flexibility into the model and can be used with or without cure fraction assumption (Royston & Parmar 2002; Lambert & Royston 2009). Stata Conference, Chicago 2011
References • Dickman, P.W. & Adami, H.O. 2006. Interpreting trends in cancer patient survival. J.Intern.Med., 260, (2) 103-117. • Dickman, P.W., Sloggett, A., Hills, M., & Hakulinen, T. 2004. Regression models for relative survival. Stat.Med., 23, (1) 51-64. • Durrleman, S. & Simon, R. 1989. Flexible regression models with cubic splines. Stat.Med., 8, (5) 551-561. • Lambert, P.C. 2007. Modeling of the cure fraction in survival studies. Stata Journal, 7, (3) 1-25 • Lambert, P.C., Thompson, J.R., Weston, C.L., & Dickman, P.W. 2007. Estimating and modeling the cure fraction in population-based cancer survival analysis. Biostatistics, 8, (3) 576-594. • Lambert P.C., Royston P. 2009. Further development of flexible parametric models for survival analysis. The Stata Journal ;9:265-90. • Royston P., Parmar M.K. 2002. Flexible parametric proportional-hazards and proportional-odds models for censored survival data, with application to prognostic modelling and estimation of treatment effects. Stat Med ;21:2175-97. • Statistics Canada 2010, Table 102-0504: Deaths and mortality rates, by age group and sex, Canada, provinces and territories, annual (2112 series), Statistics Canada. Stata Conference, Chicago 2011