Launch
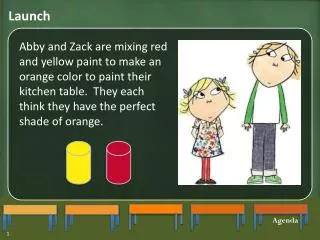
Launch. Abby and Zack are mixing red and yellow paint to make an orange color to paint their kitchen table. They each think they have the perfect shade of orange. Agenda. Launch. Zack ’ s orange paint is made by mixing 3 cups of red for every 5 cups of yellow. This sounds like a ratio.

Launch
E N D
Presentation Transcript
Launch Abby and Zack are mixing red and yellow paint to make an orange color to paint their kitchen table. They each think they have the perfect shade of orange. Agenda
Launch Zack’s orange paint is made by mixing 3 cups of red for every 5 cups of yellow. This sounds like a ratio. What are ratios again? Agenda
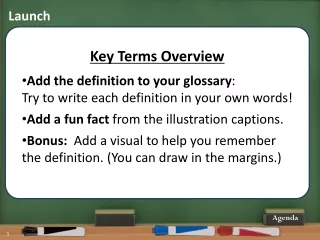
Launch Here’s the definition: A ratio is a relationship between two or more quantities. But, why would I want to use or think about a ratio? Here’s a short video that will show how ratios are used in a few real life situations. Agenda
Launch – Think, Pair, Share Zack’s orange paint is made by mixing 3 cups of red for every 5 cups of yellow. Lefty – Tell Righty the ratio of red to yellow in Zack’s orange paint. Righty – Tell Lefty the ratio of yellow to red in Zack’s orange paint. Class – What is the ratio of red to yellow in Zack’s orange paint? Partner Share 3 to 5 or 3:5 or 3 5 3:5 Agenda
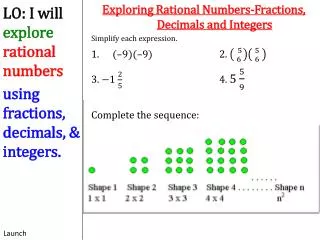
Explore – Strategize Zack bought 24 cups of red paint. How much yellow paint will Zack need to buy to make his shade of orange paint? 3:5 Write down in your notes any ideas you have about how to answer this question. Agenda
Explore – Mini-Lesson Before we solve Zack’s problem, let’s look at some simpler problems to get ready. Read this problem. Example 1) The ratio of boys to girls in a class is 2 to 3. 1. If there are 4 boys in the class, how many girls are there? Agenda
Explore – Mini-Lesson Let’s learn about a helpful toolfor ratio problems that could help you with all sorts of ratio problems. Example 1) The ratio of boys to girls in a class is 2 to 3. 1. If there are 4 boys in the class, how many girls are there? Agenda
Explore – Mini-Lesson New Tool: Tape Diagram We can use a tape diagram to solve ratio math problems. Example 1) The ratio of boys to girls in a class is 2 to 3. Each box represents a number in the original ratio. boys girls 1. If there are 4 boys in the class, how many girls are there? Now let’s look at the question. Agenda
Explore – Mini-Lesson New Tool: Tape Diagram We can use a tape diagram to solve ratio math problems. Example 1) The ratio of boys to girls in a class is 2 to 3. If this tape shows 4 boys then… boys girls 1. If there are 4 boys in the class, how many girls are there? Agenda
Explore – Mini-Lesson New Tool: Tape Diagram We can use a tape diagram to solve ratio math problems. Example 1) The ratio of boys to girls in a class is 2 to 3. 4 How many students are in one box? This tape is 4 boys. So we put 4 above the tape. 2 2 boys girls 2 1. If there are 4 boys in the class, how many girls are there? Agenda
Explore – Mini-Lesson New Tool: Tape Diagram We can use a tape diagram to solve ratio math problems. Example 1) The ratio of boys to girls in a class is 2 to 3. 4 We don’t yet know the number of girls so we put a ? for the length of that tape. Important Rule: The number in each box must be the same for every tape. 2 2 boys 2 2 2 girls ? 1. If there are 4 boys in the class, how many girls are there? Agenda
Explore – Mini-Lesson New Tool: Tape Diagram We can use a tape diagram to solve ratio math problems. Example 1) The ratio of boys to girls in a class is 2 to 3. 4 2 2 Now we can answer the question. boys 2 2 2 girls ? 1. If there are 4 boys in the class, how many girls are there? 6 Agenda
Explore – Mini-Lesson New Tool: Tape Diagram Let’s try another one. Example 2) The ratio of boys to girls in a class is 3 to 2. ? We can label what we know. 8 girls. First, draw the tapes. boys We can put a question mark for what we don’t know. girls 8 2. If there are 8 girls in the class, how many boys are there? Now let’s look at the question. Agenda
Explore – Mini-Lesson New Tool: Tape Diagram Let’s try another one. Example 2) The ratio of boys to girls in a class is 3 to 2. ? How many students does each box represent? boys This makes 8 girls. 4 4 girls 4 8 2. If there are 8 girls in the class, how many boys are there? Agenda
Explore – Mini-Lesson New Tool: Tape Diagram Let’s try another one. Example 2) The ratio of boys to girls in a class is 3 to 2. ? Remember: Every box must have the same quantity. boys 4 4 4 4 4 girls 8 2. If there are 8 girls in the class, how many boys are there? 12 Can you answer the question using the diagram? Advanced: Think of one way you could prove that the numbers in each box should be 4. Tell your partner. Agenda
Explore Tape Diagrams can be a helpful tool for solving problems. Check this out for more about how tape diagrams work: Click “Watch video” for a demonstration. Agenda
Practice You will have 15 minutes to work on solving some ratio problems using the tape diagrams tool. You might feel a little confused and want to talk about it. Don’t worry – you will discuss it when you are finished. Agenda
Discuss Check with a partner to see if you have the same answers. See if you used your tape diagram tools in the same way. You have 10 minutes. Agenda
Discuss If you and your partner cannot agree on a diagram, put a star next to the problem. Let’s look at questions 3 and 4. Check to see if you and your partner completed the tape diagrams in the same way. Agenda
Discuss Answers 6 6 6 6 6 6 sour oranges 6 4 4 4 4 4 8 red marbles 8 Agenda
Discuss Did you and your partner complete the tape diagrams the same way? Did you get the same answers? Agenda
Discuss Did you and your partner complete the tape diagrams the same way? Did you get the same answers? 24 children playing 10 apples 24 10 playing 8 8 8 apples 5 5 resting 8 oranges 5 5 5 Agenda 8 15 Agenda
Summary – Write in your notebook What is one thing you like about the tape diagrams as a tool? What is one thing that is difficult? Is there anything that is confusing about using tape diagrams as a tool? Agenda
Exit Ticket New Tool: Tape Diagram Let’s solve this problem using a tape diagram. The question is: How many cups of yellow paint does Zack need to make his shade of orange paint? We know: Zack’s orange paint is made by mixing 3 cups of red for every 5 cups of yellow. And, we know: he bought 24 cups of red paint. Since every box must have the same quantity… Now we can figure out how many cups each box represents. If 3 boxes are 24 then… This is a 3:5 ratio of red to yellow. 24 Let’s label the diagram. 8 8 8 red Let’s draw the tapes. 8 8 8 8 8 yellow ? 40 cups of yellow paint That means the answer is: Agenda
Exit Ticket New Tool: Tape Diagram Now that you learned a new tool use it to solve Zack’s paint problem. Remember: Zack’s orange paint is made by mixing 3 cups of red for every 5 cups of yellow. He bought 24 cups of red paint. Use tape diagrams as a tool to find out how much yellow paint Zack will need to buy to make his orange paint. Agenda
Assessment Carefully review the tape diagram tool and solution. What is wrong here? The ratio of grapes to strawberries in a fruit salad is 4 to 1. If there are 20 grapes in the salad then how many strawberries are there? grapes 20 20 20 20 strawberries 20 Answer: So the number of grapes is 20. Agenda