Modeling Nitrogen and Phytoplankton Dynamics in the Gulf of Maine and Georges Bank Region
This research project focuses on modeling the local and external processes influencing nitrogen and phytoplankton dynamics in the Gulf of Maine (GoM) and Georges Bank (GB) regions. Collaboratively conducted by a team of experts from UMASS-D and NMFS, the project integrated continuous runs for FVCOM+NPZD models, analyzed the effects of freshening, and validated against various datasets. Insights gained aim to improve the understanding of nutrient cycling and phytoplankton responses to environmental changes, with implications for marine ecosystems.

Modeling Nitrogen and Phytoplankton Dynamics in the Gulf of Maine and Georges Bank Region
E N D
Presentation Transcript
Modeling the influence of local/external processes on nitrogen and phytoplankton dynamics in the GoM/GB region R. JiWith help from:PI team: Davis, Chen, Beardsley, Townsend, Durbin, Runge, FlaggUMASS-D modeling group: Q. Xu, G. Cowles, R. Tian, S. Hu, D. StuebeNMFS: D. Mountain, J. Hare, M. Taylor
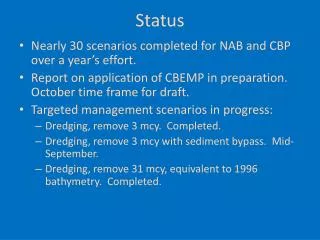
Status • Completed 1995-1999 continuous run for FVCOM+NPZD; comparing data/model results • Completed 1995 Pseudocalanus model run; using “stage with mean age” method; Testing different implementation of CPD • Examining effect of freshening on phytoplankton dynamics (data analysis + numerical exp.) • 1 ms. submitted to JMS + 1 ms. to be submitted to GRL + 1 new baby
Model skills Degree of agreement: (Willmott, 1981)
Model vs data in Basins Wilkinson Basin Jordan Basin
Sensitivity to BC (Wilkinson Basin) (GB crest)
Nitrogen cycle Redline from Pastsuzak et al., 1982
N demand and supply on GB Total N demand: ~1.26x10³ mol N s-1 (Horne et al., 1989) New N supply: ~0.48x10³ mol N s-1 (Townsend & Pettigrew, 1997) ~5x10³ mol N s-1 (Horne et al., 1989)
Modeled N flux on GB Summertime new N supply 0.23x10³ mol N s-1 Summertime f ratio = 0.18
Issues • Huge amount of model output, O(TB) • Very limited availability of data in GoM during GLOBEC year (N, Vertical profile) • Boundary conditions (N/P/Z/D, T/S) • Need free grad students