Status :
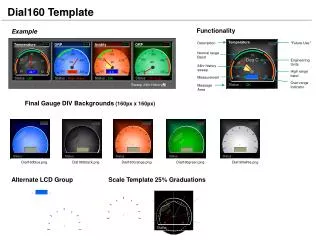
29.7. Dial160 Template. Functionality. Example. Temperature. Description. “Future Use”. Temperature. ORP. Acidity. ORP. Acidity. Auto. Auto. Auto. Man. Normal range Band. 30. 300. 6.5. 300. 30. Deg C. 29. 200. 6.25. 200. Engineering Units. 400. 400. 6.75. 31.

Status :
E N D
Presentation Transcript
29.7 Dial160 Template Functionality Example Temperature Description “Future Use” Temperature ORP Acidity ORP Acidity Auto Auto Auto Man Normal range Band 30 300 6.5 300 30 Deg C 29 200 6.25 200 Engineering Units 400 400 6.75 31 Deg C mV pH mV 29 31 24hr history sweep High range band 28 100 6.0 100 32 500 7.0 500 29.7 300.0 6.3 0.0 28 32 Measurement 29.7 Status : Status : Status : Status : OK High Alarm OK Off Scan Over-range indicator Status : OK Message Area Sweep 24hr History Final Gauge DIV Backgrounds (160px x 160px) Status : Status : Status : Status : Status : Dial160blue.png Dial160black.png Dial160orange.png Dial160green.png Dial160whte.png Alternate LCD Group Scale Template 25% Graduations Status :
Acidity pH Meas Set Point Output ON OFF OK Status : -5 0 +5 Temperature Deg C Meas Set Point 29.0 27.5 29.7 29.7 29.7 29.7 29.7 29.7 History : 26.5 Min 29.3 AVG 31.2 Max OK Status : -5 0 +5 6.48 6.48 6.4 6.4 Bar160 Template Example Functionality Controller “Future use” Acidity Description Eng units pH ORP Conductivity High Alarm Meas 300 300 24hr History of measurement Set Point 200 200 400 400 Controller Output mV mV Output Setpoint ON OFF 100 100 500 500 300.0 0.0 Message Area Measurement bar Status : Status : High Alarm Off Scan OK Status : Low Alarm Error Indicator (meas – spt) Sweep 24hr History -5 0 +5 Cbar160black.png 24hr History of error Final bar DIV Backgrounds (160px x 160px) Indicator Temperature Deg C Meas Set Point 29.0 27.5 Meas Set Point Meas 24hr History History : 26.5 Min 29.3 AVG 31.2 Max Set Point History : Min AVG Max Output ON OFF OK Status : Status : Status : -5 0 +5 Ibar160black.png Indicator is used if you are not controlling or cannot sense the output. i.e. you measure the temperature however the thermostat is standalone and not monitored. Thus you only measure the Temperature. You can optionally show the setpoint or desired setting on the themostat. Indicator is not yet finalized
16 12 8 4 1 UV Local Weather Conditions Barometer 1015 24 hours 1027 1002 hPa 990 1040 Inside Temperature 50 20 20 25 25 25 75 30 30 DegC DegC % 100 40 40 0 0 0 Humidity Ourside Inside
16 12 8 4 1 UV Weather Station 50 20 20 25 25 25 30 75 30 DegC DegC % 40 100 40 0 0 0 Humidity Ourside Inside 1015 1027 1002 hPa NNW 33 kmh 990 1040 Rainfall Barometer 8hr Today 24hr Current Gust 1 hr
16 16 12 12 8 8 4 4 1 UV 1 UV Weather Station NNW 33 kmh Rainfall Wind Speed Today 24hr Current 20 50 50 20 25 25 25 25 30 75 75 30 DegC DegC % % 100 40 40 100 0 0 0 0 Weather Station Humidity Humidity Ourside Inside Wind [klm/hr ] Gust 1 hr Speed NNW 33 kmh Rain Fall (mm) Temperature Today 24hr Current 40 1015 1015 30 Inside 1027 1027 1002 1002 20 hPa hPa Outside 10 o o C C 0 990 990 1040 1040 Gust 1 hr
ORP ORP ORP ORP 300 300 300 300 200 200 200 200 400 400 400 400 11:05 pm 11:05 pm mV mV mV mV 100 100 100 100 500 500 500 500 300.0 300.0 300.0 300.0 Status : Status : Status : Status : High Alarm High Alarm High Alarm High Alarm 11:05 pm 11:05 pm Aquarium Online Data 20-Aug-2012 10:08 pm 8.65pH287mv27.6DegC