Download
1 / 20
200 likes | 339 Vues
What is Student Progress Monitoring and How Will it Help Me?. Laura Florkey School Psychologist Princeton City Schools. What is Data-Based Decision Making?.

E N D
What is Student Progress Monitoring and How Will it Help Me? Laura Florkey School Psychologist Princeton City Schools
What is Data-Based Decision Making? • According to the National Center for Student Progress Monitoring, data-based decision making is a time-efficient way for educators to make informed instructional decisions and to quantify students’ rate of progress. • It enables you to achieve two goals that are both essential for improving student achievement. • 1. To help you examine the effectiveness of the instructional strategies you use. • 2. To help your school raise student achievement and demonstrate its success. • These are critical under the provisions of No Child Left Behind.
www.studentprogress.org Curriculum Based Measurement (CBM) • Curriculum Based Measurement (CBM) is an essential element of data-based decision making and student progress monitoring. • CBM is a standardized assessment system used to assess and monitor student progress in the academic areas of reading, mathematics, and written expression.
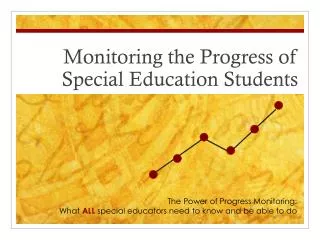
Why Monitor Student Progress? • Teachers can analyze student CBM scores and adjust student goals and instructional programs • Student data can be compared to teacher’s classroom or school district data • Can be graphed to provide a visual record of student performance
How Can Progress Monitoring Help My Students? • Progress Monitoring is designed to: • Identify students who are not demonstrating adequate progress • Compare the effectiveness of different forms of instruction • Thereby helping teachers design more effective, individualized instructional programs for struggling learners! • Also provides the information required to make data-based decisions at team meetings • Great documentation to show that an intervention is or is not beneficial • Intervention data is required by law and by your building!
How Can Progress Monitoring Help My Students? • An effective way to communicate information about your students. • Graphs provide visual data that is clear to both parents and students. • Graphs are great to use in progress reports, team meetings, and conferences.
What to Examine in CBM Data • INCREASING SCORES: • Student is progressing in that academic skill area. • FLAT/DECREASING SCORES: • Student is not benefitting from instruction and requires a change in the instructional program.
Progress Monitoring (PM) and RTI • PM is an essential tool for RTI. • With PM, student academic performance is assessed using CBMs. • Decisions about movement through the Tiers in RTI are made based on PM data.
Progress Monitoring at Tier 1 • All students are universally screened using CBM. • Students whose scores fall below benchmark are suspected as being at-risk for reading or math difficulties. • These suspected at-risk students should be closely monitored for 4 to 8 weeks to confirm or disconfirm their at-risk status
Setting Appropriate Goals • Create Your Goal • Use existing benchmarks • Create your own goal using expected growth rates • Graph your goal • Draw a line across the page at the level of the goal • Draw a line from baseline to the goal
Creating Literacy Goals Using Weekly Growth Rates for Oral Reading Fluency Grade LevelRealistic StandardAmbitious Standard 1st Grade 2 3 2nd Grade 1.5 2 3rd Grade 1 1.5 4th Grade .85 1.1 5th Grade .5 .8 6th Grade .3 .65 Goal Formula: Current performance X (growth rate X the number of weeks until id goal reviewed) = YOUR GOAL!
Example • 3rd grader Ben’s median R-CBM score = 35. • 10 weeks until the Winter Break • Team would like to see Ben make progress at a similar rate to his peers (1.0 words/week). • 35 WRC/min+ (10wks x 1.0) = 45WRC/min • This is the goal by Winter Break!
Hintze, John M. Using Student Progress Monitoring in a Response to Intervention Model Making Decisions: 3 Point Rule If 3 weeks of instruction have occurred and student has at least 6 data points, examine the most recent 3 consecutive scores. • If all 3 scores fall below the goal line, a change in instruction is recommended. • If all 3 scores fall above the goal line, a goal raise is recommended.
(http://www.studentprogress.org Making Progress or Not?
Progress Monitoring atTier 2 • Use the goal-setting and decision-making standards to make decisions. • In addition to the core curriculum, students in Tier 2 receive supplemental intervention • Student benchmark and growth status is evaluated after several weeks of intervention – Students at or above benchmark return to Tier 1 – Students below benchmark, but making adequate growth progress remain in Tier 2 • – Students below benchmark and continuing to demonstrate poor growth progress are moved to Tier 3
Progress Monitoring at Tier 3 • Students receive more intense individualized interventions. • Progress monitoring data should be collected frequently (i.e., weekly). • After several weeks, student progress toward their goal should be examined using the 3 point decision making rule. • Students making progress can move back to Tier 2 • Unresponsive students remain in Tier 3
Helpful Tips • Create a bulletin board so that your students can see their progress and goals. • Monitor 1 or 2 students every week instead of monitoring the whole group at one time during group interventions. • Have students use graph paper to graph their own data.
Helpful Resources! • National Center For Student Progress Monitoring • www.studentprogress.org • Many valuable resources and information • Intervention central • www.Interventioncentral.org • A variety of interventions ideas and information for educators • Create your own math worksheets and reading probes for free!
Helpful Resources • Chart Dog • http://www.jimwrightonline.com/php/chartdog_2_0/chartdog.php • Create your own chart and graphs for free • DIBELS • https://dibels.uoregon.edu/measures/ • Progress monitoring materials for literacy skills are FREE after you create a username and password • RTI in the Classroom: Guidelines and Recipes for Success • Rachel Brown-Chidsey,
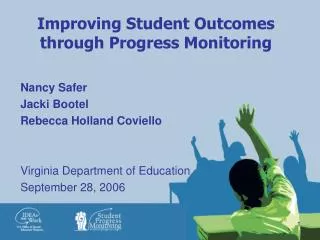
References • Safer, Nancy. Improving Student Outcomes Through Progress Monitoring [PowerPoint Slides]. Retrieved from http://www.studentprogress.org/library/presentations.asp#applyingrti • National Center on Student Progress Monitoring www.studentprogress.org • Hintze, John M. Using Student Progress Monitoring in a Response to Intervention Model [PowerPoint Slides]. Retrieved from www.studentprogress.org/doc/webinars/RTIwebinarslides_000.pdf