Download
1 / 21
210 likes | 349 Vues
This educational resource, developed by NASA's GPM Education and Public Outreach Team, explores how geographic features such as mountains, water bodies, and elevation influence climate and weather patterns. With guiding questions centered on key concepts like the differences between weather and climate, and how to interpret climatograms, learners will engage in interactive activities to analyze climate data from various locations. Extension activities include creating your own climatogram using real data to deepen understanding of geographic impacts on temperature and precipitation.

E N D
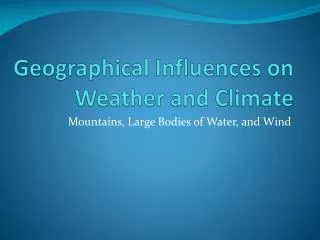
Global Precipitation Measurement Mission Developed by the GPM Education and Public Outreach Team NASA Goddard Space Flight Center Geographical Influences on Climate Lesson
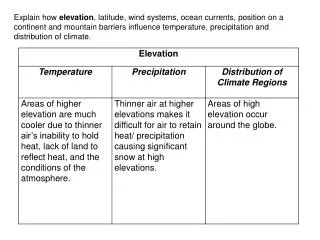
Guiding Questions Geographic Features: What are geographic features and how do they affect temperature and precipitation? Weather versus Climate: What are the similarities and differences between weather and climate? Climatograms: How can you easily see climate data about a location? What analysis tools can you use to compare the climate data for different locations? Geographical Influences on Climate: How do nearness to large bodies of water, elevation and the location of mountains affect temperature and precipitation?
Engage – Name Geographic Features • Name some geographic features you know. Can you think of any ways they might affect temperature or precipitation? Image source: Microsoft ClipArt
Engage – Volcano! Ash and Steam Plume, Soufriere Hills Volcano, Montserrat • THINK: Look at the NASA picture at right. Think about what geographic factors are present that might affect the weather or climate at locations A, B and C. • PAIR: Share at least one idea with your partner. • SHARE: Raise your hand if you'd like to share something you and your partner discussed.
Weather versus Climate • What is the difference between weather and climate? weather climate
Climatograms • What do you notice about the climatogram below?
Vocabulary Term to be familiar with: • prevailing winds - which direction the wind usually blows at a particular location (referred to by the direction the wind is COMING FROM)
Maps of Geographic Features • What do you notice about the maps below?
Climatograms for U.S. Cities • Look at the map and climatogram you have been given. Observe the patterns in the data, and make notes and calculations on your capture sheet about precipitation, temperature, elevation, and any land features such as oceans, lakes and mountains. • After you have examined your climatogram, you will compare yours with those of other classmates.
Effect on coastal locations Image source: http://www.prh.noaa.gov/hnl/kids/activities.php
Create your own climatogram • Use the instructions to get data from NASA TRMM, weather.com, intellicast.com, wunderground.com, or other websites about a location around the world. • Follow the directions to make a climatogram using Excel. • Find your location on a map, and draw or label the features around it. • Using what you have learned about the effect of geographic features, write paragraphs describing the temperature and precipitation patterns at your location, as well as the effect of elevation, bodies of water, and mountains. • Be sure to refer to the checklists and rubric to make sure you include all the required information.
Extension Activities Extension Activities
Rain Shadow Satellite Images Satellite Images and the Rain Shadow Effect in the Pacific Northwest
Landsat 5 Image of Oregon From NASA Earth Observatory, accessed 8/6/2013, http://earthobservatory.nasa.gov/IOTD/view.php?id=79247
Compared to a Photograph Compared to photographs/ natural-color images from Google. (Some areas are images from satellites, but the most high-resolution images are from aerial photography.)
Andes Mountains Natural-color image of the rain shadow of the Andes Mountains, 250 km southeast of La Paz, Bolivia. http://earthobservatory.nasa.gov/IOTD/view.php?id=8830
Mahale Mountains National Park, Tanzania http://earthobservatory.nasa.gov/IOTD/view.php?id=6014