Download
1 / 85
850 likes | 1.19k Vues
Alcohol in Ontario: Consumption, High Risk Drinking, Harm & Policy Implications. Norman Giesbrecht & Anca Ialomiteanu Centre for Addiction & Mental Health Toronto, Ontario Presented at the 5 th annual Alcohol: No Ordinary Commodity Forum

E N D
Alcohol in Ontario:Consumption, High Risk Drinking, Harm & Policy Implications Norman Giesbrecht & Anca Ialomiteanu Centre for Addiction & Mental Health Toronto, Ontario Presented at the 5th annual Alcohol: No Ordinary Commodity Forum Adapting National & Provincial Alcohol Strategies for Local Impact Ben Franklin Centre, Ottawa, Ontario March 27, 2008
Acknowledgements This presentation draws, in part, from other presentations, papers and reports. We wish to thank the following persons: Lise Anglin, Thomas Babor, Angela Boak, Thomas Greenfield, William Kerr, Robert Mann, Jayadeep Patra, Svetlana Popova, Jürgen Rehm, John Rogers, Robin Room, and Michael Roerecke. Special thanks are extended to Edward Adlaf, the Principal Investigator of the CAMH Monitor survey of Ontario Adults. The views and opinions expressed in these slides and in this presentation are those of the presenters and do not necessarily reflect those of the persons acknowledged.
Overview • Drinking patterns in Ontario since 1977 • Trends in heavy and high risk drinking • Contributions of high risk drinkers to overall consumption • Damage from alcohol • Public opinion on alcohol policy • Policy implications
Trends in self reported alcohol use in Ontario 1977-2005 • Trends in drinking patterns • Trends in heavy and high risk drinking • Trends in drinking and driving
Ontario Surveys 1977-2005 Sampling Designs • Our data is based on 20 repeated cross sectional surveys conducted conducted by the Addiction Research Foundation (ARF) from 1977 to 1998 and Centre for Addiction and Mental Health (CAMH) from 1999 to 2005). • 1977-1989 – the Ontario Adult Drug Use series - were face to face interviews and were conducted by Gallup Canada (sample sizes varied between 1,041 and 1,101). • 1991-1995 - the Ontario Adult and Other Drug Opinion Survey series were based on Computer Assisted Telephone interviewing, using random digit dialling methods and a two stage probability selection and were administered by the Institute for Social Research at York University (sample sizes varied between 1,000 and 2,022).
CAMH Monitor 1996 –2005 Annual Ontario Adult Survey • The CAMH Monitor series started in 1996 and is on-going. • A repeated cross-sectional monthly telephone survey of Ontario adults, using random digit dialling techniques – one survey cycle is based on the aggregation of 12 independent monthly surveys, with approx. 200 completions each month (approx. 2400 completions each year). • Design – two-stage probability survey stratified by six geographical regions with sample sizes allocated equally. • Sample sizes for the years 1996-2005 varied between 2406 to 2721, and response rates varied between 58% to 69%. • The sample is representative for Ontarians aged 18 years and older (approx. 9, 120,000 individuals in 2005)
Standard Drink of Alcohol in Canada • Beer 341 mL or 12 oz of 5% strength • Distilled Spirits 43 mL or 1.5 oz of 40% strength • Wine: 142 mL or 5 oz of 12% strength All contain about 13.6 grams of ethanol
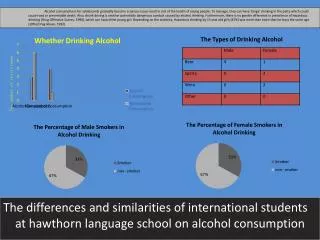
Prevalence of Past Year Alcohol Use • The prevalence of past year drinking is defined as the percentage consuming alcohol at least once during the past 12 months. • In 2005, 78.9% of Ontarians reported drinking in the past year. This rate was not significantly different from 2004 (81.2%). • Men were more likely to drink than women (84% vs. 76%) and rate was significantly higher among those living in the North (82%) and lowest in Toronto (74%).
Trends in Alcohol Use 1977-2005 • 1977-1996 alcohol use increased between 1982 and 1992 (all-time high at 87%), and then decreased from 85% in 1995 to 79% in 1996. • 1997 - 2005 significant variation, with a low found in 2000 at 77.1% and a high of 81.2% in 2004. This increase was especially evident among women, from a low of 72.5% in 1998 to a high of 77.5 % in 2004.
Past 12 Months Alcohol Use by Gender, Ontario Adults, 1977-2005
Past 12 Months Alcohol Use by Age Groups, Ontario Adults, 1977-2005
Average No. of Drinks Consumed per Week • In contrast to the prevalence of drinking, which describes the size of the drinking population, the estimated no. of drinks consumed is an indicator of the quantity of alcohol consumed. • In 2005, the average number of drinks reported by Ontario drinkers was 3.8 drinks/week. • Men consumed an average of 5 drinks/week compared to 2.6 drinks for women; • Those aged 18 to 29 reported the highest average number of drinks/week (4.4).
Trends in Average No. of Drinks/ Week • 1992-1996: the average no. of drinks decreased from 4.7 in 1992 to 3.3 in 1996, but started increasing in 1997. • 1997 – 2005: the average no. of drinks consumed increased from 3.4 to 3.8, but the overall difference was not significant. There was however a significant increase • among women (from 1.9 in 1996 to 2.6 in 2005) • among 40 to 49 year olds (from 2.8 in 1995 to 4.3 in 2005) and • among those withless than high school education (from 3.4 in 1996 to 6.1 in 2005).
Average No. of Drinks Consumed per Week in the Past 12 Months, Ontario Drinkers, 1992-2005
Average No. of Drinks Consumed per Week in the Past 12 Months by Gender, Ontario Drinkers, 1992-2005
Average No. of Drinks Consumed per Week in the Past 12 Months by Age, Ontario Drinkers, 1992-2005
Low Risk Drinking Guidelines - CAMH & Partners • No more than 2 standard drinks per day • Up to 14 standard drinks per week – males • Up to 9 standard drinks per week – females Please note that these guidelines were developed about 10 years ago, based on available epidemiological and other relevant research at that time. Health Canada is currently drafting national drinking guidelines, and when they are released, the specific numbers might be slightly different than those in the LRDG.
Exceeding the Low Risk Drinking Guidelines (LRDG) • Respondents are considered to have exceeded the LRDG if they report : • A weekly consumption of 15 drinks or more for men • 10 drinks or more for women, • OR for both, more than 2 drinks at least once over the past week. • In 2005, 25% of Ontarians (32% of drinkers) reported exceeding the LRDG. • Men are 2.3 times more likely than women to drink at this level (33.6% vs. 16.9%); • Rate was highest among those aged 18 to 29 (38%) and lowest among those 65 years and older (12%).
Trends in Exceeding the LRD Guidelines in the Past 12 Months, Ontario Adults • Short term trends: Between 2003 and 2005, the percent of Ontarians exceeding the LRDG has increased significantly from 21.4% to 25%. This increase was especially evident for 40-49 years olds, and those with some post secondary education.
Percent Exceeding the Low Risk Drinking Guidelines in the Past 12 Months, Ontario Adults, 2003-2005
Prevalence of Heavy Drinking Episodes • We used 2 indicators to measure heavy drinking : • Monthly heavy drinking - consuming 5 or more drinks on a single occasion once a month or more often. • Weekly heavy drinking- consuming 5 or more drinks on a single occasion on a weekly basis - an indicator of regular heavy intake of alcohol. • In 2005, 30% of Ontarians reported monthly heavy drinking and 11% reported heavy drinking on a weekly basis. • For both measures rates were higher among men, among those aged 18 to 29 and lowest among those with university degree.
Trends in Heavy Drinking • 1996-2005: rates of monthly heavy drinking decreased from 1996 to 1998 and then increased significantly from 24% to 30% in 2005, especially among women and among 18 to 29 year olds. • 1977-1995: For weekly heavy drinking two distinct periods are evident. • Rates remained stable between 1977 and 1995 but have increased significantly in 1996 (from 7% to 12%) and have since remained at this elevated level. These increases were especially evident among men and 18 to 29 year olds.
Monthly Heavy Drinking in the Past 12 Months, Ontario Adults,1996-2005
Monthly Heavy Drinking in the Past 12 Months by Gender, Ontario Adults, 1996-2005
Monthly Heavy Drinking in the Past 12 Months by Age Groups, Ontario Adults, 1996-2005
Weekly Heavy Drinking in the Past 12 Months, Ontario Adults, 1977-2005
Weekly Heavy Drinking in the Past 12 Months by Gender, Ontario Adults, 1977-2005
Weekly Heavy Drinking in the Past 12 Months by Age Groups, Ontario Adults, 1977-2005
Hazardous Drinking (AUDIT 8+) • Hazardous drinking is based on the WHO’s Alcohol Use Disorder Identification Test (AUDIT). • The scale is based on 10 items measuring alcohol intake, alcohol adverse reactions and alcohol dependence. Each item has 5 options (0-4) and the total AUDIT score ranges from 0 to 40. • A score of 8 or more (out of 40) is used to estimate the percentage who drink at hazardous or harmful levels.
Prevalence of Hazardous Drinking • In 2005, 10.4% of Ontarians, aged 18 and over, reported hazardous or harmful drinking; men were 3 times more likely than women to report this drinking pattern (15.5% vs. 5.6%) and 18 to 29 year olds reported the highest rate (26%). • Among drinkers, 8.7% reported at least one dependence symptom and 25% reported at least one alcohol problem.
Trends in Hazardous Drinking (AUDIT 8+) • 1998-2005- although there was a numeric decline in hazardous drinking , the trend was not significant. • There was a significant decline between 2004 and 2005 (from 13.9% to 10.4%); however we cannot interpret changes between 2 annual surveys as indicative of a long-term trend.
Hazardous Drinking (Audit 8+) in the Past 12 Months, Ontario Adults, 1998-2005
Hazardous Drinking (Audit 8+) in the Past 12 Months by Gender, Ontario Adults, 1998-2005
Prevalence of Drinking and Driving Among Drivers • The prevalence of past year drinkingand driving is defined as the percentage of Ontarians with a valid driver’s licence driving within one hour of consuming 2 or more drinks at least once during the past 12 months. • In 2005, 6.2% of Ontario drivers reported drinking and driving. • Men were more likely to drink and drive than women (10% vs. 2%); those aged 30 to 39 years reported the highest rate (8%) and drinking and driving was lowest in Toronto (2.5%).
Trends in Drinking and Driving • 1996-2005: there was a significant steady linear decline from 13% in 1996 to 6% in 2005. • This decline occurred for both men and women, and for all age groups.
Prevalence of drinking and driving in the past 12months, Ontario Drivers,1996-2005
Prevalence of drinking and driving in the past 12months by gender, Ontario Drivers,1996-2005
Prevalence of drinking and driving in the past 12months by age groups, Ontario Drivers,1996-2005
Summary: Some Positive Findings • There was some indication that the prevalence of hazardous drinking decreased. The 2005 estimate (10%) is the lowest since 1998. The decline was especially evident among men from 23% in 1998 to 16% in 2005. • The prevalence of drinking and driving displayed a significant linear decline from 13% in 1996 to 6% in 2005, and the 2005 estimate is the lowest since 1996.
Summary: Some Public Health Flags • Although the prevalence of drinking has not changed dramatically, there was some indication that drinking increased among women. • Past year drinking among women increased from 72.5% in 1998 to 77.5% in 2004, and the average no. of drinks/week increased from 1.9 in 1996 to 2.5 in 2005 • Heavy drinking still remains at an elevated level, with one in 7 drinkers (14%) reporting weekly heavy drinking and one in 3 drinkers (34%) reporting monthly heavy drinking. • The rate of weekly heavy drinking increased between 1995 and 1996 and has since remained at this elevated level, especially among men. • In addition, almost one in 3 drinkers (32%) consume alcohol at levels exceeding the recommended guidelines
Key: Top line is total consumption, 2nd is beer, 3rd is spirits, 4th is wine
Drinking Patterns & Rates in Canada • Results from the Canadian Community Health Surveys suggest that high-risk drinking has increased from 10% to 14% between 1993 and 2004. • The 2004 Canadian Addiction Survey found that 23% of past-year drinkers exceeded the low-risk drinking guidelines. • Also, 17% of past-year drinkers were considered to drink hazardously (Alcohol Use Disorders Identification Test). • Both high risk drinking patterns and overall consumption levels have been shown to impact chronic disease and trauma related harm from alcohol. Source: Statistics Canada, Canadian Community Health Surveys; Adlaf, Begin & Sawka, 2005
Litres of Absolute Alcohol, per capita aged 15+. Ontario, 1986-2005
Concentration of U.S. Alcohol Consumption Top 10% drinking > 3 drinks/day: 58% of Total Top 5%drinking > 4 drinks/day:40% of Total Source: adapted from Greenfield & Rogers, JSA,1999; also Kerr & Greenfield, ACER, 2007
Hazardous Drinking: U.S. Percentage OF TOTAL OF BEVERAGE Hazardous Nonhazardous Share 58.4% 14.9% 26.7% (Hazardous drinking occurs more in bars, other people’s parties, and public places) Source: adapted from Rogers & Greenfield, JSA,1999