Download
1 / 8
80 likes | 297 Vues
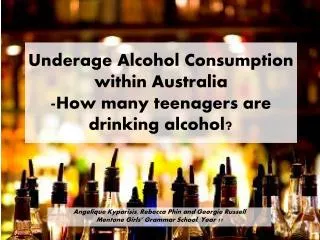
Underage Alcohol Consumption within Australia -How many teenagers are drinking alcohol?. Angelique Kyparisis , Rebecca Phin and Georgie Russell Mentone Girls’ Grammar School, Year 11. Introduction.

E N D
Underage Alcohol Consumption within Australia-How many teenagers are drinking alcohol? Angelique Kyparisis, Rebecca Phin and GeorgieRussell Mentone Girls’ Grammar School, Year 11
Introduction... Our group chose to collect data on the topic of ‘teenage drinking’ as we feel that this is unfortunately an ongoing trend throughout Australian society today. Many young people are drinking alcohol and are also therefore related in many accidents, induced by alcohol consumption. Our question that we came up with, ‘how many teenagers are consuming alcohol?’ has enabled us to collect a series of data from internet sources to analyse and ultimately answer the question.
http://ndri.curtin.edu.au/local/docs/pdf/naip/naip007.pdf Statistics These two graphs compare males from 14-17 years of age to males of all ages, and the amounts of alcohol that they consume at either a high or low risk, indicating the level of injuries and harm that can occur. The first graph shows that 21% of males from 14-17 years old drink large amounts of alcohol classified at a very high risk which can cause harm. This is compared to 24% of males at all ages.
http://ndri.curtin.edu.au/local/docs/pdf/naip/naip007.pdf Continued... This comparison suggests that males between the ages of 14-17 are consuming similar high risk amounts of alcohol as males with the most possibility of being older than them. The graphs also show that males who are 14-17 are consuming alcohol with a low risk of harm a lot less than males of all ages who are consuming alcohol with a low risk of harm, almost all of the time.
http://ndri.curtin.edu.au/local/docs/pdf/naip/naip007.pdf Statistics These two graphs, in conjunction to the two on the last slide compare the low or high risk of alcohol consumption in which may cause injuries and harm at females aged 14-17 and at all ages. The first graph indicates that 75% of females aged 14-17 are at a low risk of causing injury or harm, whilst the second graph indicates that 83% of females of all ages are also classified at a low risk of causing harm or injury.
http://ndri.curtin.edu.au/local/docs/pdf/naip/naip007.pdf Continued... These two graphs state that females aged 14-17 are at higher risk of causing harm or injury after consuming alcohol compared to the females of all ages. This is due to the increase in reckless underage drinking, in saying this the numbers are not all that great, yet it is visible of the increase in teen alcohol consumption.
http://karongraham-edutake.blogspot.com.au/2012/05/parties-are-meant-to-be-fun-and-most.htmlhttp://karongraham-edutake.blogspot.com.au/2012/05/parties-are-meant-to-be-fun-and-most.html Statistics This scatter plot (created by data collected from an Australian source- 2011) presents the ages in which Australians try their first alcoholic beverage. As the legal age for drinking is 18 years and older in Australia, it is staggering to see from the graph above that by age 12 already 25% of children have their first drink. The graphs data has a strong correlation. By age 15, 62% of the people have tried an alcoholic beverage. The average age for having a first drink of alcohol is at age 14, as the graph shows.
Conclusion In conclusion, our group came across many statistics in which had been collected from various sources revealing the trend of drinking alcohol amongst people under the age of 18. All of our data was reviewed and collected and then retranslated into graphs of our own. Whilst we wanted our information to be clear we decided that by using bar graphs and scatter plots we could present fourth information that is easy to read and understand. The information we collected revealed that underage male and females are consuming alcohol at a high risk on a similar scale, either averaging the same or higher to those who are over 18 and legal. The average age for consuming alcohol was also found to be at age 14.