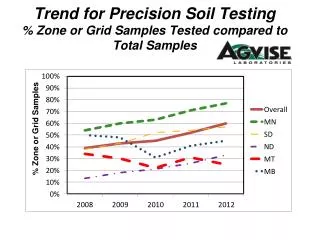
Trend for Precision Soil Testing % Zone or Grid Samples Tested compared to Total Samples
350 likes | 469 Vues
This report analyzes the trends in precision soil testing between zone or grid samples and conventional whole field composite samples, focusing on data from AGVISE Laboratories from 1997 to 2012. It provides insights into soil nitrate variability following various crops (wheat, barley, sunflower, corn, etc.) and assesses the nutrient levels across different regions (ND, MN, SD). The findings highlight significant differences in nutrient distribution and availability, emphasizing the value of precision agriculture for optimizing soil health and crop yields.

Trend for Precision Soil Testing % Zone or Grid Samples Tested compared to Total Samples
E N D
Presentation Transcript
Trend for Precision Soil Testing% Zone or Grid Samples Tested compared to Total Samples
AGVISE Laboratories%Zone or Grid Samples Tested Compared to Conventional Whole Field Composite Samples in 2012
AGVISE Laboratories%Zone or Grid Samples – Northwood laboratory1997 - 2012 % Grid or Zone Samples Tested Compared To Conventional Whole Field Composite Samples Tested
Average Soil Nitrate following Wheat in 2012 MB Fall 2012 Samples 44 (lb/a 0-24” samples) 48 43 65 38 64 41 42 33 47 47 44 44 ND 50 51 43 48 50 42 57 MN 50 67 SD 39 43
Soil Nitrate Variability Between Fields Following “WHEAT” in 2012
Average Soil Nitrate Following “WHEAT” 1986-201226 Years of history! 107 96 81 68 64 Nitrate-N (0-24”) 61 60 60 59 56 54 53 50 48 46 46 45 44 43 42 41 40 38 35 35 32 29 86 88 90 92 94 96 98 00 02 04 06 08 10 11 2012
Average Soil Nitrate Following Wheat For Region (1986-2012)Deep “N” (24-48” lb/a) 63 59 53 51 49 46 44 43 41 Nitrate-N (24-48” lb/a) 35 36 34 32 31 29 29 29 27 20 19 18 18 18 15 14 14 13 86 88 90 92 94 96 98 00 02 04 06 08 10 12
Soil Nitrate Variability Between Fields Following “Barley” in 2012
Average Soil Nitrate Following “BARLEY 1986-2012 95 84 70 56 53 53 52 Nitrate-N (0-24” lb/a) 50 48 47 45 45 43 41 40 39 39 37 38 35 35 35 34 30 29 29 27 86 88 90 92 94 96 98 00 02 04 06 08 10 12
Soil Nitrate Variability Between Fields Following “Sunflower” in 2012
Average Soil NitrateFollowing “SUNFLOWER” 1986- 2012 101 82 70 55 Nitrate-N (0-24” lb/a) 50 50 50 50 49 48 48 47 47 46 44 44 43 43 40 39 34 33 32 30 27 25 22 86 88 90 92 94 96 98 00 02 04 06 08 10 12
Soil Nitrate Variability Between Fields Following “Dry Beans” 2012
Average Soil Nitrate Following “DRY BEANS” 1986-2012 102 100 78 72 70 66 65 65 61 61 58 58 57 55 53 53 52 Nitrate-N (0-24” lb/a) 51 49 46 46 44 41 39 38 35 34 86 88 90 92 94 96 98 00 02 04 06 08 10 12
Soil Nitrate Variability Between Fields Following “Sugarbeet” in 2012
Average Soil NitrateFollowing “SUGARBEET” 1986- 2012 53 48 47 Nitrate-N (0-24” lb/a) 30 25 25 25 25 23 22 22 22 21 21 21 21 20 20 20 19 18 17 17 16 16 15 13 86 88 90 92 94 96 98 00 02 04 06 08 10 12
Soil Nitrate Variability Between Fields Following “Fallow” in 2012
Average Soil Nitrate Following “FALLOW” 1986-2012 149 143 128 119 102 98 93 85 84 81 80 79 79 75 69 Nitrate-N (0-24” lb/a) 67 66 62 60 60 59 58 55 50 48 46 46 86 88 90 92 94 96 98 00 02 04 06 08 10 12
Soil Nitrate Variability Between Fields Following “Soybeans” in 2012
Average Soil NitrateFollowing “Soybeans” 1995- 2012 Nitrate-N (0-24” lb/a) 35 35 33 32 30 31 30 30 29 29 28 27 27 26 24 23 23 21 95 97 99 01 03 05 07 09 11 2012
Average Soil Nitrate following Corn in 2012 Fall 2012 samples MB (lb/a 0-24” samples) 89 63 113 54 67 46 50 ND 68 54 52 44 57 63 64 MN 77 56 SD 85 83 114 62
Soil Nitrate Variability Between Fields Following “Corn” in 2012
% Soil Samples with Phosphorus less than 10 ppm Fall 2012 samples MB 38% (0-6” samples) 35% (Olsen P test) 50% 58% 20% 60% 27% 14% 34% 78% 66% 77% 55% 67% 72% ND 47% 57% 69% 56% 68% 36% 71% MN 47% 57% 36% SD 36% 46% 60% 50% 32%
% Soil Samples with Potassium less than 150 ppm MB Fall 2012 samples 32% 11% (0-6” samples) 38% 32% 19% 6% 11% 30% 17% 2% 3% 2% 14% 77% 36% ND 5% 21% 78% 7% 48% 6% 48% 1% 4% 23% MN 31% SD 41% 1% 3% 21% 35%
% Soil Samples with Zinc less than 1.0 ppm MB Fall 2012 samples 35% 59% (0-6” samples) 53% 65% 32% 66% 49% 24% 35% 72% 83% 56% 78% 44% ND 54% 77% 22% 86% 65% 65% 20% 91% 50% MN 59% 35% SD 26% 74% 49% 36% 34%
% Soil Samples with Sulfur less than 15 lb/a MB Fall 2012 samples 10% 7% (0-6” samples) 11% 5% 9% 12% 15% 9% 12% 54% 14% 22% 8% 32% 9% ND 18% 38% 10% 40% 21% 49% 46% 29% MN 67% 20% 49% SD 27% 69% 59% 19% 44%
% Soil Samples with %OM less than 3.0% MB Fall 2012 Samples 9% 8% (0-6” samples) 20% 13% 33% 29% 29% 17% 25% 71% 33% 43% 22% 21% 26% ND 25% 60% 75% 26% 28% 38% 26% 55% MN 28% 12% 9% SD 17% 28% 3% 26% 9%
% Soil Samples with Chloride less than 40 lb/a MB Fall 2012 Samples 51% (0-24” samples) 34% 55% 78% 13% 59% 42% 47% 30% 89% 56% 65% 38% 20% 63% ND 59% 85% 41% 48% 87% 77% 85% 44% MN 70% 84% SD 57% 78% 57%
% Soil Samples with Copper less than 0.5 ppm MB Fall 2012 samples 15% 7% (0-6” samples) 24% 4% 26% 12% 10% 14% 16% 2% 17% 2% 12% 29% 41% ND 7% 45% 10% 20% 13% 10% 26% 14% 5% MN 5% 4% SD 2% 1% 5% 0%
% Soil Samples with Boron less than 0.4 ppm MB Fall 2012 samples 1% (0-6” samples) 0% 1% 0% 4% 2% 8% 13% 1% 5% 2% 4% 7% 17% 5% ND 2% 15% 39% 75% 3% 15% 47% 8% 9% MN 9% SD 8% 27% 9% 35% 12%
% Soil Samples with Soil pH greater than 7.3 MB Fall 2012 samples 65% 92% (0-6” samples) 82% 74% 84% 71% 42% 72% 75% 62% 70% 51% 76% 67% 96% ND 38% 6% 65% 39% 79% 35% 43% 15% 23% MN 36% 54% SD 34% 25% 23% 27% 22%
% Soil Samples with Carbonate greater than 5.0% MB Fall 2012 samples 36% (0-6” samples) 55% 22% 22% 24% 10% 14% 40% 17% 10% 13% 7% 26% 44% 9% ND 6% 3% 12% 23% 6% 4% 1% 2% MN 9% 29% SD 6% 1% 10% 3% 10%
% Soil Samples with Salts greater than 1.0 MB Fall 2012 Samples 11% 17% (0-6” samples) 17% 21% 23% 10% 8% 12% 17% 2% 15% 8% 37% 19% 6% ND 10% 4% 0% 1% 27% 19% 3% 2% 21% MN 11% 4% SD 7% 1% 6% 12% 2%
North Dakota & NW Minnesota% Samples Testing with Salts greater than 1.0 582 Grand Forks 567 TRF 587 Minot 1:1 salt method – expressed as mmhos/cm
South Dakota - % Samples Testing with Salts greater than 1.0 572 – Watertown 573 – Huron 574 – Aberdeen 583 – Grand Forks 1:1 salt method – expressed as mmhos/cm
The Salt Problem may be Worse than this? • Composite samples • Avoid areas that don’t represent most of the field • Saline areas • Sandy ridges • Many salty fields don’t get tested • Zone sampling • The salty zones often do not get tested or fertilized