VLSI Testing
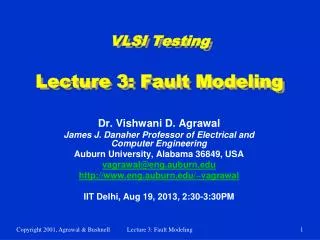
VLSI Testing. Dr. Vishwani D. Agrawal James J. Danaher Professor of Electrical and Computer Engineering Auburn University, Alabama 36849, USA vagrawal@eng.auburn.edu http://www.eng.auburn.edu/~vagrawal August 7-13, 2010. Course Description.

VLSI Testing
E N D
Presentation Transcript
VLSI Testing Dr. Vishwani D. Agrawal James J. Danaher Professor of Electrical and Computer Engineering Auburn University, Alabama 36849, USA vagrawal@eng.auburn.edu http://www.eng.auburn.edu/~vagrawal August 7-13, 2010 Lecture 1 Introduction
Course Description This course is designed for the MTech program in VLSI at IIT, Delhi. It is patterned after a one-semester graduate-level course offered at Auburn University. A set of 14 lectures that include classroom exercises provide understanding of theoretical and practical aspects of VLSI testing. The course fulfills the needs of today’s industrial design environment, which demands knowledge of testing concepts of digital, memory, analog and radio frequency (RF) subsystems often implemented on a system-on-chip (SoC). Lecture 1 Introduction
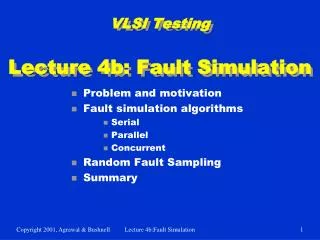
Outline • Lecture 1: Introduction (19*+1) * Number of slides • Lecture 2: Yield and quality (16+2) • Lecture 3: Fault modeling (19+2) • Lecture 4: Testability analysis (26) • Lecture 5: Logic simulation (14) • Lecture 6: Fault simulation (18) • Lecture 7: Combinational ATPG (24+2) • Lecture 8: Sequential ATPG (19+1) • Test 1 • Lecture 9: Delay test (25) • Lecture 10: Memory test (25) • Lecture 11: Analog test (24) • Lecture 12: DFT and Scan (24+2) • Lecture 13: BIST (28) • Lecture 14: System diagnosis (20) • Test 2 • Lecture 15: RF Testing: Introduction, gain measurement (39) • Lecture 16: RF Testing: Intermodulation and noise measurements (33) Lecture 1 Introduction
Schedule • Aug 7, 2010 – 4-6PM Lectures 1 and 2 • Aug 9, 2010 – 3:30-6:30PM Lectures 3, 4 and 5 • Aug 10, 2010 – 3:30-6:30PM Lectures 6, 7 and 8 • Aug 11, 2010 – 3:30-6:30PM Lectures 9, 10 and 11 • Aug 12, 2010 – 3:30-6:30PM Lectures 12, 13 and 14 • Aug 13, 2010 – 4-6PM Lectures 15 and 16 Lecture 1 Introduction
Lecture 1: Introduction • VLSI realization process • Verification and test • Ideal and real tests • Costs of testing • Roles of testing • A modern VLSI device - system-on-a-chip • Testing • Digital • Memory • Analog • RF • Textbook • Problem to solve Lecture 1 Introduction
VLSI Realization Process Customer’s need Determine requirements Write specifications Design synthesis and Verification Test development Fabrication Manufacturing test Chips to customer Lecture 1 Introduction
Definitions • Design synthesis: Given an I/O function, develop a procedure to manufacture a device using known materials and processes. • Verification: Predictive analysis to ensure that the synthesized design, when manufactured, will perform the given I/O function. • Test: A manufacturing step that ensures that the physical device, manufactured from the synthesized design, has no manufacturing defect. Lecture 1 Introduction
Verification Verifies correctness of design. Performed by simulation, hardware emulation, or formal methods. Performed once prior to manufacturing. Responsible for quality of design. Test Verifies correctness of manufactured hardware. Two-part process: 1. Test generation: software process executed once during design 2. Test application: electrical tests applied to hardware Test application performed on every manufactured device. Responsible for quality of devices. Verification vs. Test Lecture 1 Introduction
Problems of Ideal Tests • Ideal tests detect all defects produced in the manufacturing process. • Ideal tests pass all functionally good devices. • Very large numbers and varieties of possible defects need to be tested. • Difficult to generate tests for some real defects. Defect-oriented testing is an open problem. Lecture 1 Introduction
Real Tests • Based on analyzable fault models, which may not map on real defects. • Incomplete coverage of modeled faults due to high complexity. • Some good chips are rejected. The fraction (or percentage) of such chips is called the yield loss. • Some bad chips pass tests. The fraction (or percentage) of bad chips among all passing chips is called the defect level. Lecture 1 Introduction
Testing as Filter Process Mostly good chips Good chips Prob(pass test) = high Prob(good) = y Tested chips Fabricated chips Prob(pass test) = low Prob(fail test) = low Mostly bad chips Defective chips Prob(bad) = 1- y Prob(fail test) = high Lecture 1 Introduction
Costs of Testing • Design for testability (DFT) • Chip area overhead and yield reduction • Performance overhead • Software processes of test • Test generation and fault simulation • Test programming and debugging • Manufacturing test • Automatic test equipment (ATE) capital cost • Test center operational cost Lecture 1 Introduction
Present and Future* 2003 - 2006 1997 -2001 Feature size (micron) 0.25 - 0.15 0.13 - 0.10 Transistors/sq. cm 4 - 10M 18 - 39M Pin count 100 – 900 160 - 1475 Clock rate (MHz) 200 – 730 530 - 1100 Power (Watts) 1.2 – 61 2 - 96 * SIA Roadmap, IEEE Spectrum, July 1999 Lecture 1 Introduction
Design for Testability (DFT) DFT refers to hardware design styles or added hardware that reduces test generation complexity. Motivation: Test generation complexity increases exponentially with the size of the circuit. Example: Test hardware applies tests to blocks A and B and to internal bus; avoids test generation for combined A and B blocks. Int. bus Primary outputs (PO) Primary inputs (PI) Logic block A Logic block B Test input Test output Lecture 1 Introduction
Cost of Manufacturing Testing in 2000AD • 0.5-1.0GHz; analog instruments; 1,024 digital pins: ATE purchase price • = $1.2M + 1,024 x $3,000 = $4.272M • Annual running cost (five-year linear depreciation) • = Depreciation (1/5) + Maintenance (2%) + Operation ($0.5M) • = $0.854M + $0.085M + $0.5M • = $1.439M/year • Test cost (24 hour ATE operation) • = $1.439M/(365 x 24 x 3,600) • = 4.5 cents/second Lecture 1 Introduction
Roles of Testing • Detection: Determination whether or not the device under test (DUT) has some fault. • Diagnosis: Identification of a specific fault that is present on DUT. • Device characterization: Determination and correction of errors in design and/or test procedure. • Failure mode analysis (FMA): Determination of manufacturing process errors that may have caused defects on the DUT. Lecture 1 Introduction
A Modern VLSI DeviceSystem-on-a-chip (SOC) DSP core RAM ROM Transmission medium Data terminal Mixed- signal Codec Inter- face logic Lecture 1 Introduction
Textbooks • Digital, memory and mixed-signal: • M. L. Bushnell and V. D. Agrawal, Essentials of Electronic Testing for Digital, Memory and Mixed-Signal VLSI Circuits, Springer, 2000. • http://www.eng.auburn.edu/~vagrawal/BOOK/books.html • RF testing • J. Kelly and M. Engelhardt, Advanced Production Testing of RF, SoC, and SiP Devices, Boston: Artech House, 2007. • B. Razavi, RF Microelectronics, Upper Saddle River, New Jersey: Prentice Hall PTR, 1998. • K. B. Schaub and J. Kelly, Production Testing of RF and System-on-a-chip Devices for Wireless Communications, Boston: Artech House, 2004. Lecture 1 Introduction
Problem to Solve • Using the testing cost obtained in Slide 15, determine what is the component of test in the cost of a mixed-signal VLSI chip for the following data: • Analog test time = 1.5 s • Digital test clock = 200MHz • Number of digital test vectors = 109 • Chip yield = 70% Lecture 1 Introduction
Solution Assuming that one vector is applied per clock cycle during the digital test, the rate of test application is 200 million vectors per second. Therefore, Digital test time = (1000 × 106)/(200× 106) = 5 seconds Adding the analog test time, we get, Total test time = 1.5 + 5.0 = 6.5 seconds The testing cost for a 500 MHz, 1,024 pin tester was obtained as 4.56 cents in Slide 15. Thus, Cost of testing a chip = 6.5 × 4.56 = 29.64 cents The cost of testing bad chips should also be recovered from the price of good chips. Since the yield of good chips is 70%, we obtain Test cost in the price of a chip = 29.64/0.7 ≈ 42 cents 42 cents should be included as the cost of testing while figuring out the price of chips. Lecture 1 Introduction