Download
1 / 6
60 likes | 93 Vues
Learn how to create impactful graphical displays such as Bar Graph, Pareto Chart, Circle Graph, Time Plot, and Time Series to effectively present data for analysis and decision-making. Each technique is explained in detail with examples and best practices.

E N D
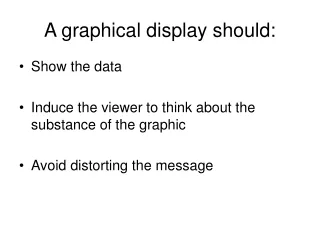
A graphical display should: • Show the data • Induce the viewer to think about the substance of the graphic • Avoid distorting the message
Bar Graph • bars of uniform width • uniformly spaced • may be vertical or horizontal • lengths represent quantities being compared • provide title, labels for each bar and lengths of bars
Pareto Chart • tool of quality control • start with a bar chart • arrange bars in decreasing order of frequency • frequently used to investigate causes of problems
Circle Graph (Pie Chart) • shows division of whole into component parts • label parts with appropriate percentages of the whole
Time Plot • Shows data values in chronological order • time on horizontal scale • variable being measured on vertical scale • connect data points with line segments
Time Series • Time series are data sets composed of similar measurements taken at regular intervals over time. • A time plot can reveal some features of a time series.