Download
1 / 17
170 likes | 292 Vues
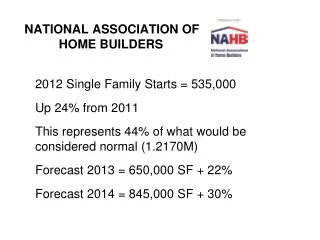
NATIONAL ASSOCIATION OF HOME BUILDERS. 2012 Single Family Starts = 535,000 Up 24% from 2011 This represents 44% of what would be considered normal (1.2170M) Forecast 2013 = 650,000 SF + 22% Forecast 2014 = 845,000 SF + 30%. CORE LOGIC. IN 2012: Total Homes Sales Increased 6%

E N D
NATIONAL ASSOCIATION OF HOME BUILDERS 2012 Single Family Starts = 535,000 Up 24% from 2011 This represents 44% of what would be considered normal (1.2170M) Forecast 2013 = 650,000 SF + 22% Forecast 2014 = 845,000 SF + 30%
CORE LOGIC IN 2012: • Total Homes Sales Increased 6% • Non-Distressed Home Sales Increased 11% • REO Sales Declined 20% (3rd consecutive decline) • Serious Delinquencies Dropped 7.4% 6.9% • Core Logic Home Price Index (based on repeat sales) Increased 6.3% (largest since 2006)
GLAR MLS 2012 • Existing Home Sales Have Posted Six Consecutive Quarters of Sales Growth (starting in Q3 2011) Houses Sold on MLS ‘06 ‘07 ‘08 ‘09 ‘10 ‘11 ‘ 12 ‘12 vs.’11 15,181 14,748 11,369 11,648 11,442 10,974 12,724 +15.9% Median Sales Price ‘06 ‘07 ‘08 ‘09 ‘10 ‘11 ‘ 12 ‘12 vs.’11 138.5 139.0 134.9 132.0 138.0 134.1 140.0 +4.3% • Average and Cumulative Day on Market Both Down in ’12 vs. ‘11
Residential Building Permits 2012 20122011’12 vs ’11 Jefferson 1003 671 +49.4 Oldham 156 112 39.3 Shelby 136 73 86.3 Spencer 47 46 2.2 Bullitt 29221337.1 1634 1115 +46.5% Clark 349 227 +53.7 Floyd 169 98 72.4 Harrison 96 6450.0 614 389 +57.8% 8-County Total 2,248 1504 +49.5% Note: Nelson 114 122 -6.6% Hardin 254 210 +21% Source: The Market Edge
Residential Building Permit 2012Market Comparison %CHANGE MARKET 2012 vs. 2011 Louisville KY 42.5% Lexington KY 33.1% Evansville IN 24.3% Asheville NC 21.5% Charlotte NC 30.4% Fayetteville NC ------- Hickory NC 12.3% Triad NC 3.2% Triangle NC 31.8% Upstate NC 32.1% Chattanooga TN 27.7% Knoxville TN 23.9% Tri-Cities TN -4.5% Source: The Market Edge
5294 5137 5015 4790 4348 4225 Permits 3749 3297
5294 5137 5015 4790 4348 4225 Permits 3749 3297
97.5% 59.6% 52.6% 49.5% 48.8% 38.6% 34.2% 29.9% 13.2% -1.2% -2.4% -11.7% -18% -22.5% -27.7% Source: local government permitting departments