Double Entry System 3
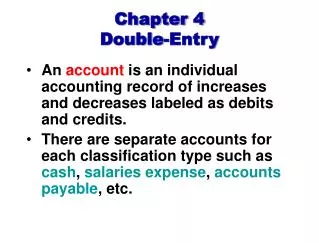
Double Entry System 3. DR. CR. FINANCIAL STATEMENTS. An Overview…. General Journal. Special Journals. Ledger Accounts. Trial Balance. Adjustments. Prepare Simple Financial Statements. Objectives At the end of the lesson, students should be able to :


Double Entry System 3
E N D
Presentation Transcript
Double Entry System 3 DR CR
An Overview… General Journal Special Journals Ledger Accounts Trial Balance Adjustments Prepare Simple Financial Statements
Objectives • At the end of the lesson, students should be able to : • know the purpose of preparing Final Accounts. • know what is a Trading Profit & Loss • Statement. • know how to draw up a Trading P & L • statement and a Balance Sheet on the last • day of the accounting period.
Opening Stock + Net Purchases – Closing Stock = Cost of goods sold Cost price + Profit = Selling price Cost of goods sold + Gross Profit = Net Sales
How does Trading a/c looks like? Trading Account for the year ended 31 Dec 2000 $ $ $ $ Opening Stock XX Sales Less: Returns Inwards XX (XX) XX (XX) XX (XX) XX XX Purchases Less: Returns Outwards Less: Closing Stock Costs of Gds Sold Gross Profit * XX XX XX XX
An Example Trading Account for the year ended 31 Dec 2000 $ $ $ $ Opening Stock 1,000 Sales Less: Returns Inwards 23,000 (1,400) 12,000 (2,000) 11,000 (2,300) 8,700 12,900 Purchases Less: Returns Outwards Less: Closing Stock Costs of Gds Sold Gross Profit * 21,600 10,000 21,600 21,600
Net Profit = Gross Profit + Operating Revenues – Operating Expenses
How does Profit & Loss a/c looks like? Profit & Loss Account for the year ended 31 Dec 2000 $ $ XX XX Gross Profit * Revenues XX XX Expenses Net Profit ** XX XX
An Example Profit & Loss Account for the year ended 31 Dec 2000 $ $ Gross Profit * Commission Revenue Interest Revenue 12,900 7,500 1,000 Rent Expense Insurance Expense Wages Depreciation Interest Expense Transport Expenses Net Profit ** 1,000 3,400 7,000 3,000 1,200 2,580 3,220 21,400 21,400
Recall….Balance Sheet Assets =Owner’s Equity + Liabilities BALANCE SHEET AS AT 1 Jan 2000 Fixed Assets$ $ Building Office Equipment Motor Vehicle Fixtures Current Assets Stock (*closing) Debtors Bank Cash Owner’s Equity $ Capital Add: Profits Less: Drawings Long Term Liabilities Loan from bank Current Liabilities Creditors Other creditors Same figure
A = OE + L Example BALANCE SHEET AS AT 1 Jan 2000 Fixed Assets$ $ Motor Vehicle 25000 Fixtures 10050 35050 Current Assets Stock 4570 Debtors 7400 Cash 630 12600 Owner’s Equity $ Capital 38000 Long Term Liabilities Loan from bank 3000 Current Liabilities Creditors 6650 47650 47650