Download
1 / 25
250 likes | 608 Vues
Cost-Effectiveness of Surgical Aortic Valve Replacement versus Transcatheter Aortic Valve Replacement Using Registry Data. Christopher U. Meduri, MD Matthew R. Reynolds, Philippe Généreux, Andrew N. Rassi, David A. Burke and Jeffrey J. Popma American College of Cardiology

E N D
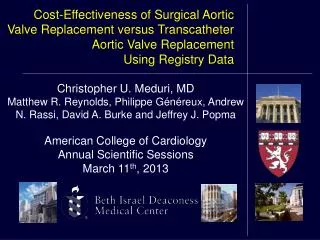
Cost-Effectiveness of Surgical Aortic Valve Replacement versus Transcatheter Aortic Valve Replacement Using Registry Data Christopher U. Meduri, MD Matthew R. Reynolds, Philippe Généreux, Andrew N. Rassi, David A. Burke and Jeffrey J. Popma American College of Cardiology Annual Scientific Sessions March 11th, 2013
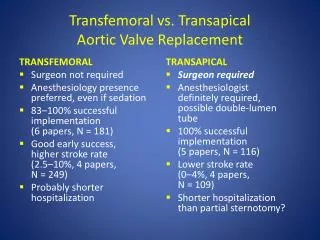
Background • PARTNER Cohort A is the only randomized-control trial evaluating TAVR vs. SAVR in high-risk patients. • The 12-Month cost-effectiveness analysis in the PARTNER Cohort A study (TAVR vs. SAVR) showed: • Transfemoral (TF)-TAVR vs. SAVR: ∆ QALYs = + 0.06; • ∆ Cost = - $2,210 • Transapical (TA)-TAVR vs. SAVR: ∆ QALYs = - 0.07; • ∆ Cost = + $9,595. • Detailed cost-effective analysis has not been extensively evaluated in “real world” patients undergoing TAVR and SAVR. Reynolds MR, Cohen DJ JACC 2012
Objectives • To determine the cost-effectiveness of TAVR compared with high-risk isolated SAVR outside of RCTs. • To explore potential differences in the cost-effectiveness of TF-TAVR and TA-TAVR compared with isolated SAVR. • To identify the influence of varying rates of procedural complications on the cost-effectiveness of TF-TAVR, TA-TAVR and SAVR.
Methods • Markov decision analytic model (TreeAge Pro software) with Monte Carlo simulations. • Model informed with: • Outcome Probabilities: Derived from meta-analysis of 20 TAVR Registries and 8 isolated SAVR Registries. • Costs: Utilized PARTNER A CEA and current literature review of costs of complications. • Quality of Life: Utilized PARTNER A CEA and current literature review of QoL related to complications. • All cost and benefits discounted at 3%. • Probabilities and utilities in Beta-distributions. • Lifetime model with mortality after year 1 from adjusted US life-tables based on changes in mortality from year 1 to 2 in TAVR registry.
Markov Model 30-Day 1-Year Annual
Registry Data Meta-Analysis *Vascular Complications for Cardiac Surgery were not available from registry data so a vascular complication rate was imputed from TA-TAVR.
Costs • In hospital, hospital to 12 months and annual cost derived from median costs from PARTNER A CEA. • Each upfront cost provided for in hospital/30d cost. After that patients given annual cost x11/12 for first year, then full cost annually. • Annual TAVR/SAVR Annual Cost (after year 1) made the same, based on average of median outpatient cost in year one for TF/SAVR arm of PARTNER A.
Utilities One-Month One-Year • All Well Utilities based on results of PARTNER A CEA. • Utilties for Major Stroke (0.32), Minor Stroke (0.71) and Hemodialysis (0.70) were mutliplied times Well utilities to inform our model. • Disutilities were assigned for New Pacemaker (3 days) and Vascular Complication (1 week).
Transfemoral TAVR v. SAVR . More Effective, More Cost Less Effective, More Cost ∆ Cost = - $1110 ∆ QALYs = + 0.36 ICER = dominant % <$50,000 per QALY = 92.8% More Effective, Less Cost Less Effective, Less Cost
Transapical TAVR v. SAVR % <$50,000 per QALY = 11.2% More Effective, More Cost Less Effective, More Cost ∆ Cost = + $2995 ∆ QALYs = - 0.22 ICER = dominated More Effective, Less Cost Less Effective, Less Cost
The Learning Curve of Transapical? Partner A Transapical Continued Access Registry *Partner A Transapical Continued Access Registry excluded from our meta-analysis because it is not published. Dewey T STS 2012
TA TAVR Using PARTNER A Continued Access Transapical Data % <$50,000 per QALY = 36.1% More Effective, More Cost Less Effective, More Cost ∆ Cost = + $4437 ∆ QALYs = + 0.02 More Effective, Less Cost Less Effective, Less Cost
Limitations • This is a non-randomized analysis from registry data, and as such it is possible that both identified and unidentified confounders may have influenced the outcomes. • Costs and quality of life were not directly obtained and instead outcome and cost data were derived from PARTNER A CEA and literature review. • Comparison of TA to SAVR outcomes in this observational study is limited by unmeasured confounding related to choice of access route. • The actual rate of complications, apart from death, beyond 30 days is not available in observational databases for these cohorts.
Summary • In this analysis of “real world” high-risk registries, transfemoral TAVR is an economically dominant strategy compared with isolated SAVR • This Markov model supports the PARTNER A CEA, though the magnitude is greater in the real world than seen in RCTs. • Sensitivity analyses suggest that with significantly increased rates of major stroke (up to 8%), vascular complications or pacemaker implantation, transfemoral TAVR remains preferred.
Summary • In contrast, SAVR is economically preferrable to transapical TAVR in high-risk patients. • However, accounting for the “learning curve” demonstrated in the PARTNER A Transapical Continued Access Registry, transapical TAVR become an economically more acceptable option for high risk patients.
Conclusions • Markov modeling is an effective tool to evaluate the cost-effectiveness of TAVR in high risk patients reported in real world clinical registries.
Acknowledgements Jeff Popma, M.D. Matt Reynolds, M.D., M.Sc. Philippe Généreux, M.D. David Cohen, M.D., M.Sc. Myriam Hunink, M.D., PhD Brian Potter, M.D. Duane Pinto, M.D, MPH David Burke, M.D. Andrew Rassi, M.D.
To contact author: cmeduri@bidmc.harvard.edu
Base Case Summary • For All Patients: • TAVR provided 5.28 QALYs and Cost $108,660 • SAVR provided 5.07 QALYs and Cost $111,036 • TAVR is an economically DOMINANT strategy compared with SAVR: • Improvement of 0.21 QALYs • Cost Savings of $2,376
Transfemoral TAVR Using PARTNER A Stroke Rate . More Effective, More Cost Less Effective, More Cost ∆ Cost = + $3227 ∆ QALYs = + 0.20 More Effective, Less Cost Less Effective, Less Cost
2-Way Sensitivity Analysis for Stroke and Vascular Complications 50 40 Favors SAVR Favors TAVR 30 Vascular Complication Rate (%) 20 10 0 3 6 9 12 15 Stroke Rate (%)