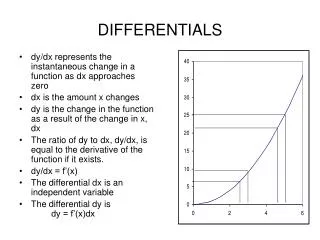
Hospital Quality, Efficiency, and Input Slack Differentials
Hospital Quality, Efficiency, and Input Slack Differentials Vivian Valdmanis, Ph.D. University of the Sciences in Philadelphia Philadelphia, PA

Hospital Quality, Efficiency, and Input Slack Differentials
E N D
Presentation Transcript
Hospital Quality, Efficiency, and Input Slack Differentials Vivian Valdmanis, Ph.D. University of the Sciences in PhiladelphiaPhiladelphia, PA Michael Rosko, Ph.D. Widener University School of Business Administration Chester, PA Ryan Mutter, Ph.D. Agency for Healthcare Research and Quality Rockville, MD AHRQ Annual Meeting September 10, 2008
Research Impetus • Health care reform continues to dominate at least part of the political debate on how best to eliminate the economic hardships astronomical health care costs impose on more and more Americans. • Most research and practical-based studies focus on the cost-quality-access nexus, often arguing that there are tradeoffs among these three objectives. • However, it can be argued that quality and efficiency may be directly related, especially when considering the relatively higher social costs associated with in-hospital patient safety events.
Objective • To use advances in data envelopment analysis (DEA) to assess the tradeoffs between quality and efficiency, including input slack values, in U.S. hospitals
Strengths of DEA DEA easily accommodates multiple inputs and multiple outputs. DEA doesn't impose a particular functional form relating inputs to outputs. DEA directly compares an observation against one or more actual peers. DEA allows inputs and outputs to be measured in very different units.
Weaknesses of DEA DEA is an extreme point technique, so “noise” (even symmetrical noise with zero mean) can cause significant problems. DEA is good at estimating “relative” efficiency but does not measure “absolute” efficiency. DEA is a nonparametric technique so statistical hypothesis tests are difficult to carry out. DEA requires that a separate linear program be solved for observation, which can be computationally intensive.
DEA illustrated x 2 L(u) x 1
DEA illustrated u 2 P(u) u 1
DEA illustrated x 2 u j x 1
Graph x CRS B C A u
Graph x CRS NIRS B C A* A u
Graph x CRS B C L(u,x|N,S) L(u,x|C,S) A u
Weak Disposability of Inputs x 2 u’ < u u x 1 Degree of congestion in input x2
Corner Solution x 2 Corner Solution L(u) x 1
Allocative Inefficiency x 2 AE = 0B*/0B < 1 A B B* Isoquant C Isocost Line 0 x 1
Output Efficiency u 2 OE = 0A*/0A > 1 A* A u 1
Output Congestion u 2 A* A u 1
Input Based Malmquist u Graph t+1 Graph t A B C u t+1 F E u t D x x t x t+1
Output Based Malmquist Graph t+1 u A Graph t u t+1 B F C E u t D x x t x t+1
ZAP u LVIV u ZAP A B LVIV F u C E D x x x ZAP
Subvectors (Inputs) x 2 x 1
Subvectors (Output) u 2 u 1
The Concept of a Frontier Output Just Feasible: Efficient Infeasible Feasible …But Inefficient Input
Choice of Technology CRS Output VRS Input
Choice of Orientation CRS Output Output Orientation—Scale Outputs to Reach the Frontier Input Orientation—Scale Inputs to Reach the Frontier Input
Input Orientation Input 2 (e.g., labor) Note:E is a convex combination of B and C A D B E Isoquant C O Input 1 (e.g., capital)
Help on the Web Ali Emrouznejad’s DEAZone www.DEAzone.com Tim Anderson’s DEA Homepage http://www.emp.pdx.edu/dea/homedea.html
Software Any software with LP capability SAS GAMS LINDO Commercial Software Banxia’s Frontier Analyst EMQ’s OnFront Thanassoulis’ PIMSoft/DEASoft Free Software Coelli’s DEAP Scheel’s EMS Wilson’s FEAR Coming: Morgunov and Zelenyuk’s “Just DEA It!”
Data Sources • American Hospital Association (AHA) Annual Survey of Hospitals • Medicare Hospital Cost Reports (for number of patient days in non-acute care units) • AHRQ (for measures of patient safety and hospital competition) • Solucient, Inc. (for data on county level HMO enrollment and number of residents without healthcare insurance)
Analytical File • Hospitals included in this study are those defined by the AHA as short term, community hospitals that report complete data. • Since quality variables from the application of the Patient Safety Indicator (PSI) module of the AHRQ Quality Indicator (QI) software to the Healthcare Cost and Utilization Project (HCUP) State Inpatient Databases (SID) were important in this analysis, this study was restricted to 34 states supplying HCUP data. • This yielded an analytical file of 1,377 urban hospitals in 2004.
Undesirable Events • The following risk-adjusted PSIs that Savitz, Jones, and Bernard (2005) indicate are sensitive to nurse staffing: • failure to rescue • infection due to medical care • postoperative respiratory failure • postoperative sepsis
Model • We employ DEA techniques to ascertain the necessary increases in inputs needed to reduce poor hospital outcomes. • To this end we use a two-step process. • First, we measure technical efficiency of our sample hospitals based on the works by Debreu and Farrell and updated in terms of economic efficiency by Färe, Grosskopf, and Lovell. • We opted for DEA due to the flexibility of this approach, which is particularly suited to study hospital productive performance.
Model (continued) • One of the benefits of DEA is that we can measure some outputs as weakly disposable. In our case, we use the nurse-sensitive measures of quality. • We surmise that as hospitals increase the production of patient care, if they do not maintain quality of care, these poor outcomes may also increase, hence the weak disposability.
Model (continued) • Using the Färe, Grosskopf, and Lovell approach, we measured “congestion,” which reflects how much total productivity is reduced by the presence of these bad hospital outcomes, or in other words, an increase in social costs.
Formal Definitions • Below we present the formal definitions of our technologies:
Adjusting Outputs • Once we derived the congestion score, we “discounted” the outputs by that score. This was accomplished by dividing the outputs by the congestion measure, since an increase in outputs may lead to an increased probability of producing the attendant undesirable bads.
y2 (desirable output) A* y2A* y2A B A C F D y1 (undesirable output) 0 y1A y1A* Relationship between Desirable (y2) and Undesirable Outputs (y1)
Slack Differential • Once we have the adjusted outputs, we re-run the DEA linear programs, but this time we are interested in the additive slack values ala Cooper, Seiford, and Zhu (2000). • Unlike the multiplicative congestion measure, which inhibits the production of all goods, slack does not impede total production, but may either represent a quality input or excessive inputs that lead to inefficiency.
What these differences mean • If the difference between slacks is positive, it would suggest that the hospital is employing excess input that leads to inefficiency. • If the difference is negative, it implies that inputs need to be increased to improve quality of care. In fact, the difference indicates the amount of inputs that need to be increased.
Descriptive Statistics of Efficiency Scores • If the efficiency score equals 1, the hospital is deemed efficient. Any score greater than 1 indicators inferior performance. • If congestion is greater 1, then output congestion exists and bad outcomes impede optimal production of hospital care outputs.
Summary and Conclusions • From our results, we find certain hospital characteristics are associated with inefficiency and congestion, which we use to model quality of care: • For-profit hospitals exhibited the least amount of inefficiency vis-à-vis their public counterparts • A majority of hospitals in our sample were operating at diseconomies of scale • Teaching hospitals and members of systems also performed better relative to their counterparts • Input slack demonstrated that public hospitals tended to have too many FTE other personnel and acute care beds.
Summary and Conclusions (continued) • There is an association between high quality hospitals and higher total expenditures and the use of high-tech services. • Higher quality hospitals had relatively less labor per bed than hospitals with medium quality. • An interesting finding from our analysis is that there appears to be a need for more LPNs in hospitals producing poor outcomes. • The policy implication includes more evidence that costs and quality do not necessarily need to be traded off, but rather both these objectives can be met with the resources at hand.
Contributions • In this paper, we add to the existing literature on hospital care and congestion by examining nurse sensitive measures of quality, adding to the Clement et al. paper that used excess mortality. • We look at hospital outcomes that could be confounded by congestion, similar to the Ferrier et al. study that assessed economic outcomes. • We add to the overall congestion literature by using both the Färe et al. and Cooper et al. approach for deriving first congestion, then slack.