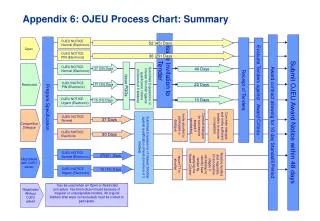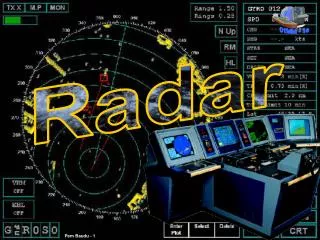
Radar Summary Chart
Radar Summary Chart. ( A 20 minute rant on THE most useless way of accessing radar data) by Dr. Bradley Muller. The Radar Summary chart —an outmoded way of looking at radar data.

Radar Summary Chart
E N D
Presentation Transcript
Radar Summary Chart (A 20 minute rant on THE most useless way of accessing radar data) by Dr. Bradley Muller
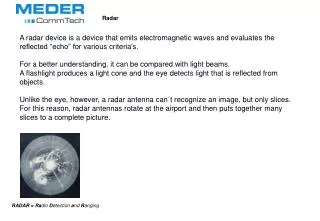
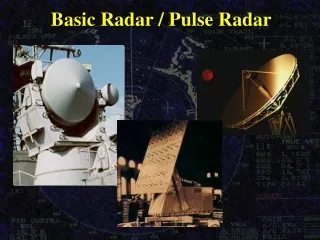
The Radar Summary chart—an outmoded way of looking at radar data. • It is a computer-generated mosaic of radar echo intensity contours based on the Radar Weather Reports (SD/ROB) text product. • Produced hourly showing precipitation types, cell movements, maximum echo tops, locations of line echoes and remarks (p. 5-50, Aviation Weather Services). • The Radar Weather Reports (SD/ROB) product is described on p. 3-45 of Aviation Weather Services.
The bad news: no human intervention! • **Here is what the government publication, Aviation Weather Services has to say about the Radar Weather Reports product: "This is a textual product derived from the WSR-88D NEXRAD radar without human intervention. The resolution of this textual product is very coarse, up to 80 minutes old, and should only be used if no other radar information is unavailable. [emphasis added]"** • By extension, I would say that the radar summary chart should only be used in the absence of other, better radar information. • **However, the FAA still tests you on the radar summary chart, which is derived from this product!!**
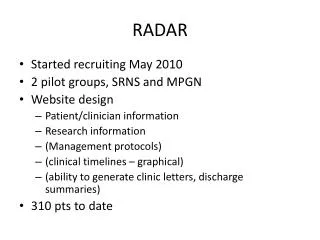
Radar Summary Chart Issued hourly Provides echo tops, echo strength, and cell movement
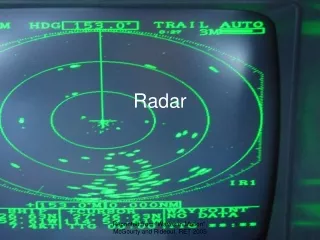
Radar Summary Chart NE = No echo NA = Not available – big difference! OM = Out for Maintenance 1st Contour – Level 1-2 radar return 2nd Contour – Level 3-4 radar return 3rd Contour – Level >5 radar return R = Rain RW = Rain Showers TRW = Thunderstorms/rain showers Underlined numbers – echo tops (100s of feet) Arrows/numbers –direction and speed (kts)
Radar Coded Message Similar to Radar Summary but color-coded and updated half-hourly Numbers indicate echo tops, wind barbs represent cell movement
Mosher’s “Day/Night Vis” at 1400z: Fog/stratus/DZ along coast. • Snow, a few Cu in the mountains. • Sacramento Valley: No clouds and no precipitation!
Radar Coded Messages for same time shows no precip. in CA and AZ.
“No human intervention” leads to thundershowers with 39,000 ft tops being reported based on ground clutter and anomalous propagation! • That’s why I hate the Radar Summary Chart—and you should too!!