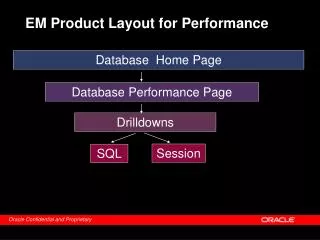
EM Product Layout for Performance
Discover comprehensive insights into SQL session performance through effective drilldowns on home page performance metrics. Utilize the ADDM (Automatic Database Diagnostic Monitor) details to identify session wait events, top SQL queries, and explore busy buffer waits. The platform’s layout facilitates a clear understanding of potential issues and optimizations in database performance. Leverage manual and automated paths for deeper analysis and improve session efficiency. Enhance your performance strategies based on detailed session analysis for optimal database management.

EM Product Layout for Performance
E N D
Presentation Transcript
EM Product Layout for Performance Database Home Page Database Performance Page Drilldowns Session SQL
Home Page Perf Page ADDM Top Session Wait Detail Top SQL ADDM Details SQL Detail Session Detail EM Pages Layout
Home Page Perf Page ADDM Top Session Wait Detail Top SQL ADDM Details SQL Detail Session Detail Three Paths
Home Page Perf Page ADDM Top Session Wait Detail Top SQL ADDM Details SQL Detail Session Detail ADDM Path
Home Page Perf Page ADDM Top Session Wait Detail Top SQL ADDM Details SQL Detail Session Detail ADDM Home
Home Page Perf Page ADDM Top Session Wait Detail Top SQL ADDM Details SQL Detail Session Detail ADDM Details
Home Page Perf Page ADDM Top Session Wait Detail Top SQL ADDM Details SQL Detail Session Detail Manual Path
Home Page Perf Page ADDM Top Session Top SQL Wait Detail ADDM Details SQL Detail Session Detail Performance Page
Home Page Perf Page ADDM Top Session Wait Detail Top SQL ADDM Details SQL Detail Session Detail Wait Drill Down
Home Page Perf Page ADDM Top Session Wait Detail Top SQL ADDM Details SQL Detail Session Detail SQL Details
Home Page Perf Page ADDM Top Session Wait Detail Top SQL ADDM Details SQL Detail Session Detail Combined