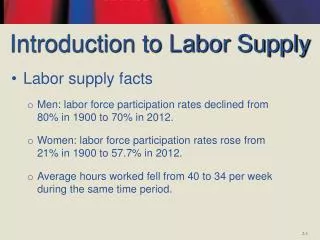
Labor Supply Facts since 1900
280 likes | 475 Vues
Labor Supply Facts since 1900. Women working more Men working less Women’s increase swamps men’s decrease, so Overall Labor Force Participation rising. Cromartie, Stella “Labor force status of families: a visual essay” Monthly Labor Review 130 (July-August, 2007): 35-41.

Labor Supply Facts since 1900
E N D
Presentation Transcript
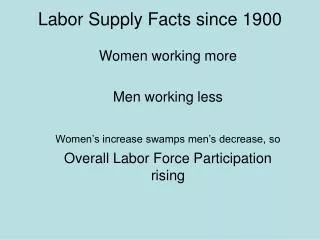
Labor Supply Facts since 1900 Women working more Men working less Women’s increase swamps men’s decrease, so Overall Labor Force Participation rising
Cromartie, Stella “Labor force status of families: a visual essay” Monthly Labor Review 130 (July-August, 2007): 35-41.
Cromartie, Stella “Labor force status of families: a visual essay” Monthly Labor Review 130 (July-August, 2007): 35-41.
Cohany and Sok, “Trends in labor force participation of mothers with children and infants” Monthly Labor Review 130 (February 2007):9-16
Cromartie, Stella “Labor force status of families: a visual essay” Monthly Labor Review 130 (July-August, 2007): 35-41.
Cromartie, Stella “Labor force status of families: a visual essay” Monthly Labor Review 130 (July-August, 2007): 35-41.
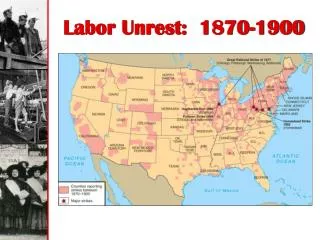
Big decrease in labor force participation for older population Social Security kick in Bureau of Labor Statistics. “Variations in Time Use at Stages of the Life Cycle.” Monthly Labor Review 128 (September 2005): 38-45.
Rising for manufacturing, falling elsewhere, but manufacturing share is decreasing Kirkland, Katie. “On the Decline in Average Weekly Hours Worked.” Monthly Labor Review 120 (July 2000): 26-31.
Men work longer hours Bureau of Labor Statistics. “Variations in Time Use at Stages of the Life Cycle.” Monthly Labor Review 128 (September 2005): 38-45.
Labor Supply Facts since 1900 Women working more Labor force participation rising for all demographic groups Average weeks worked rising Average hours per week unchanged Men working less Labor force participation falling for oldest and youngest groups Average weeks worked unchanged Average hours per week decrease Average male LFPR, weeks worked, and hours exceed female average, gap shrinking
Costa, Dora L. “From Mill Town to Board Room: The Rise of Women’s Paid Labor.” Journal of Economic Perspectives 14 (Fall 2000): 101-122.
Costa, Dora L. “From Mill Town to Board Room: The Rise of Women’s Paid Labor.” Journal of Economic Perspectives 14 (Fall 2000): 101-122.
Francine Blau, Marianne Farber and Anne Winkler. The Economics of Women, Men and Work, 5th edition Pearson Prentice Hall: 2006
Why have these changes occurred?Importance of exogenous versus endogenous factors • Tastes (attitudes toward women working) • Choices • Fertility behavior (fewer kids per woman) • Age of marriage rising • More education • Divorce Rate (Choice or Exogenous Force?)
Why have these changes occurred?Importance of exogenous versus endogenous factors • Technology • Change role of stature in workplace • Changes productivity of time in the household • Improves transportation (lowers commuting costs) • Life expectancy (especially for women?) • Need (Households need two incomes) • Wages • Overall • Wages for women (anti-discrimination legislation)
James Smith and Michael Ward, Women’s Wages and Work in the 20th Century. 1984
Is Female Labor Supply Driven by Need? Female Labor Supply Does not Fall as Household Income Increases
Life expectancy at birth by gender, 1900—1990 Biggest reason for rising life expectancy is increased chance of living to age 5 Source: Robert Wood Johnson Foundation, 1996. Chronic Care in America: A 21st Century Challenge.
Kinsella, Kevin and Yvonne J. Gist. 1998. Mortality and Health Economics and Statistics Administration, U.S. Bureau of the Census
Ratio of Female to Male Earnings .70 .60 .50 .40 .30 1800 1820 1840 1860 1880 1900 1920 1940 1960 1980 Ratio of Female to Male Earnings, 1815 to 1987 Claudia Goldin Understanding the Gender Gap: An Economic History of American Women. 1990.
Are hours flexible? Part time Workers as a Percent of total (1990) Total Voluntary Involuntary Teenagers 65% 55% 10% Men 20+ 8.7% 5.2% 3.5% Women 20+ 24% 19% 5% Shack-Martinez, “Issues in Labor Supply” Federal Reserve Bulletin, 1991.
Are hours flexible? Beers, Thomas M. “Flexible Schedules and Shift Work: Replacing the “9-5” Workday?” Monthly Labor Review 120 (June 2000): 33-40.
Are hours flexible? Campbell, Jim. “Multiple Jobholding in States, 2004.” Monthly Labor Review 128 (December 2005): 44-45.
Are hours flexible? Bureau of Labor Statistics. “Variations in Time Use at Stages of the Life Cycle.” Monthly Labor Review 128 (September 2005): 38-45.