Download
1 / 36
360 likes | 362 Vues
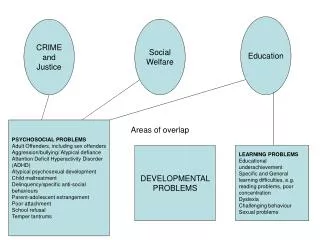
This report discusses the crime and criminal justice trends in Virginia, including offender forecasts, violent crime rates, property crime rates, and drug arrest rates. The report also highlights the decline in crime rates since the 1990s and recent changes in the definition of rape.

E N D
Crime and Criminal Justice Trends in Virginia Virginia Criminal Sentencing Commission September 21, 2015
Item 376 of Chapter 665 of the 2015 Acts of Assembly The Secretary of Public Safety and Homeland Security must present revised offender population forecasts to the Governor, the Chairmen of the House Appropriations and Senate Finance Committees, and the Chairmen of the House and Senate Courts of Justice Committees. Report is submitted in October of each year.
Four Offender Forecasts Are Produced Local-responsible (LR) prisoner population Prisoners confined in local and regional jails (excluding state and federal prisoners) State-responsible (SR) inmate population Inmates housed in DOC prison facilities and state-responsible inmates housed in jails w w w w w w w w w w w w w w Juvenile correctional center (JCC) population Juveniles committed to the state Juvenile detention home (JDH) population Juveniles placed in local facilities w w w w w w w w w w w w w w
Virginia utilizes consensus forecasting An open, participative process that brings together policy makers, administrators, and technical experts from all branches of state government Secretary of Public Safety and Homeland Security Department of Corrections Department of Juvenile Justice Department of Criminal Justice Services Department of Planning & Budget Compensation Board Supreme Court of Virginia Criminal Sentencing Commission Joint Legislative Audit & Review Commission College of William & Mary Parole Board State Police Members of Senate Finance and House Appropriations Staff of Senate Finance and House Appropriations Commonwealth’s Attorney representative Police Chief representative Sheriff representative Regional jail representative
Virginia’s Forecasting Process Policy Committee Reviews the projections and selects a forecast for each population Considers the impact of recent trends and newly adopted legislation Approves adjustments to forecasts as deemed appropriate Technical Advisory Committee Examines trends in reported crimes, arrests, court caseloads, etc. Develops multiple forecast models Scrutinizes each forecast according to the highest statistical standards Proposes forecasts with the best set of statistical properties Liaison Work Group Reviews projections proposed by the Technical Committee Requests additional data or analysis as needed Recommends forecasts to the Policy Committee w w w w w w w w w w w w w w w w w w w w w Chaired by Secretary of Public Safety and Homeland Security Chaired by Meredith Farrar-Owens Chaired by Deputy Secretaries of Public Safety and Homeland Security
Virginia’s violent crime and property crime rates have declined since the early 1990s and are now lower than any time since the 1960s. United States Violent Crime Rate (crimes per 100,00 population) Change 1992-2013: - 51% Violent index crimes are murder/ non-negligent manslaughter, rape, robbery and aggravated assault Virginia Change 1992-2013: -51% United States Property Crime Rate (crimes per 100,00 population) Change 1992-2013: - 44% Property index crimes are burglary, larceny and motor vehicle theft Virginia Change 1992-2013: - 48%
For the first time since 2005, Virginia’s violent crime rate increased in 2014, although the increase was relatively small. Violent Crime Rate in Virginia (per 100,000 population) Violent index crimes are murder/non-negligent manslaughter, rape, robbery and aggravated assault New FBI rape definition CY2013 to CY2014: +0.2% Old FBI rape definition CY2005 to CY2014: -34.9% Rate per 100,000 Old FBI rape definition CY2013 to CY2014: +0.1% In 2013, the FBI’s UCR Program began collecting data under a revised definition of rape. The term “forcible” was removed and the definition was changed to include penetration , no matter how slight, without the consent of the victim. Source: Virginia Department of Criminal Justice Services (August 20, 2015)
Rates of murder, rape and aggravated assault all increased in 2014, with only the robbery rate decreasing. In 2013, the FBI’s UCR Program began collecting data under a revised definition of rape. The term “forcible” was removed and the definition was changed to include penetration , no matter how slight, without the consent of the victim. Source: Virginia Department of Criminal Justice Services (August 20, 2015)
Virginia’s property crime rate continued to decline in 2014. Property Crime Rate in Virginia (per 100,000 population) Property index crimes are burglary, larceny and motor vehicle theft CY2005 to CY2014: -27.7% CY2013 to CY2014: -6.2% Rate per 100,000 Source: Virginia Department of Criminal Justice Services (August 20, 2015)
Virginia’s drug arrest rate declined from 2007 to 2009 but resumed its upward trend from 2010 to 2013. Despite a 6.6% decrease in 2014, Virginia’s drug arrest rate remains above the U.S. rate. Drug Arrest Rate in Virginia and the US, 2002-2014 United States Arrests per 100,000 population Virginia Virginia Drug Arrest Rates by Drug Type Source: Virginia State Police Incident-Based Crime Reporting Repository System as analyzed by the Dept. of Criminal Justice Services Research Center (August 21, 2015)
Following an increase in 2013, the total number of adult arrests decreased by 4.9% in 2014, with drops across all offense types. Drug 2014: -5.4% Number of Adult Arrests for Property and Drug Offenses in Virginia, 2005-2014 Property 2014: -4.9% Number of Adult Arrests for Violent Offenses in Virginia, 2005-2014 Violent 2014: -2.2% Figures reflect the most serious offense committed by an individual arrestee. Source: Virginia State Police Incident-Based Crime Reporting Repository System as analyzed by the Dept. of Criminal Justice Services Research Center (August 21, 2015)
Cocaine arrests have declined by 62% since 2006, while arrests for marijuana have increased by 38% since 2006. Drug Arrests in Virginia by Drug Type, 2006-2014 Marijuana field test kit implemented in 2007 Source: Virginia State Police Incident-Based Crime Reporting Repository System as analyzed by the Dept. of Criminal Justice Services Research Center (July 30, 2015)
Between 2008 and 2013, the number of arrests increased for nearly all drugs except cocaine. In 2014, arrests dropped for all drugs except heroin. Number of Drug Arrests in Virginia by Drug Type, 2005-2014 Source: Virginia State Police Incident-Based Crime Reporting Repository System as analyzed by the Dept. of Criminal Justice Services Research Center (July 30, 2015)
Department of Forensic ScienceSubmission Rate for Cocaine by Virginia State Police Division (rate of submissions per 100,000 Population) 7 2006 2010 2014 2006 2010 2014 2 1 2006 2010 2014 2006 2010 2014 2006 2010 2014 2006 2010 2014 2006 2010 2014 4 6 3 5 Source: Department of Criminal Justice Services Research Center (July 30, 2015)
Department of Forensic ScienceSubmission Rate for Heroin by Virginia State Police Division (rate of submissions per 100,000 Population) 7 2006 2010 2014 2006 2010 2014 2 1 2006 2010 2014 2006 2010 2014 2006 2010 2014 2006 2010 2014 2006 2010 2014 4 6 3 5 Source: Department of Criminal Justice Services Research Center (July 30, 2015)
While cocaine submissions to the Department of Forensic Science (DFS) still outnumber heroin statewide, heroin cases have surpassed cocaine in one area of the state. 7 2 1 3 6 4 5 Forensic Science Cases State Police Division 2 Arrests State Police Division 2 Sources: Virginia Department of Forensic Science NFLIS data, as analyzed by the Dept. of Criminal Justice Services Research Center (July 30, 2015) Virginia State Police Incident-Based Crime Reporting Repository System as analyzed by the Dept. of Criminal Justice Services Research Center (July 30, 2015)
Department of Forensic ScienceSubmission Rate for Prescription Opioid by Virginia State Police Division (rate of submissions per 100,000 Population) 7 2006 2010 2014 2006 2010 2014 2 1 2006 2010 2014 2006 2010 2014 2006 2010 2014 2006 2010 2014 2006 2010 2014 5 4 6 3 Source: Department of Criminal Justice Services Research Center (July 30, 2015)
Department of Forensic ScienceSubmission Rate for Methamphetamine by Virginia State Police Division (rate of submissions per 100,000 Population) 7 2006 2010 2014 2006 2010 2014 2 1 2006 2010 2014 2006 2010 2014 2006 2010 2014 2006 2010 2014 2006 2010 2014 5 4 6 3 Source: Department of Criminal Justice Services Research Center (July 30, 2015)
Department of Forensic ScienceSubmission Rate for “Club Drugs” by Virginia State Police Division (rate of submissions per 100,000 Population) 7 2006 2010 2014 2006 2010 2014 2 1 2006 2010 2014 2006 2010 2014 2006 2010 2014 2006 2010 2014 2006 2010 2014 4 6 3 5 Source: Department of Criminal Justice Services Research Center (July 30, 2015)
The number of felony defendants in circuit court increased between 2010 and 2013, but declined by 1.4% in 2014. Criminal misdemeanor filings in general district court have been decreasing since 2011. Felony Defendants in Circuit Court New Criminal Misdemeanor Filings in General District Court Source: Virginia Supreme Court Judicial Planning Department (July 30, 2015) 20
The number of felony sentencing events grew by 3.0% in 2013, the first increase since 2007. Preliminary data for 2014 suggest a 2.0% decrease for the year. Number of Felony Sentencing Events, CY2005 - CY2014 Change: Note: CY 2014 data are preliminary. Analysis excludes events identified as possible duplicate submissions. Source: Virginia Criminal Sentencing Commission (September 14, 2015) 21
In CY2014, the number of felony sentencing events decreased in 17 of 31 circuits, but increased in the remaining 14 circuits. Circuits with increase in felony sentencing events in CY2014 Circuits with decrease in felony sentencing events in CY2014
Local-Responsible Jail Population
The local-responsible jail population has been growing slowly over the last five years, increasing by 0.2% from FY2014 to FY2015. Local-Responsible Jail Population by Month as Measured by Average Daily Population (ADP) September 2006 21,069 October 2014 20,105 June 2015 18,726 December 2014 18,938 February 2010 17,835 Change in FY Avg. Note: Due to improvements in the LIDS-CORIS data system and support programming, average daily population (ADP) figures for January 2005 – June 2015 were updated in June 2015. Source: Compensation Board LIDS-CORIS data system (July 30, 2015) 24
In FY2015, the unsentenced/pending population in jails grew by 1.8%, while the sentenced population in jails fell by 3.5%. Sentenced (Felons and Misd.) Average Daily Population (ADP) Unsentenced/Pending Average Daily Population (ADP) +1.8% -3.5% Note: Due to improvements in the LIDS-CORIS data system and support programming, average daily population (ADP) figures for January 2005 – June 2015 were updated in June 2015. Source: Compensation Board LIDS-CORIS data system, as analyzed by the Department of Criminal Justice Services Research Center (July 30, 2015) 25
At DFS, the average number of days to complete a drug analysis has been growing since 2010, increasing by 18% from FY2014 to FY2015. Department of Forensic Science (DFS) Average Days to Complete Drug Analysis Average days to complete a case has been dropping since January 2015. Average Days to Complete Analysis Source: Virginia Department of Forensic Science data, as analyzed by the Dept. of Criminal Justice Services Research Center (July 30, 2015)
The DFS drug case backlog may result in delays in criminal case processing for those offenders charged with drug crimes, which may increase the population in jail awaiting trial. Department of Forensic Science (DFS) Average Days to Complete Drug Analysis and Unsentenced Awaiting Trial Population in Jail Source: Virginia Department of Forensic Science data, as analyzed by the Dept. of Criminal Justice Services Research Center (July 23, 2014)
State-Responsible Confined Population
Based on updated data, the state-responsible confined population increased by 3.2% and 1.4% in FY2013 and FY2014, respectively. In FY2015, the population declined by 0.3%. State-Responsible Confined Population by Month as Measured by the End-of-Month (EOM) population June 2008 39,158 June 2014 38,871 June 2015 38,761 January 2012 37,608 Change in June 30 Pop Note: Due to improvements in the LIDS-CORIS data system and support programming, average daily population (ADP) figures for state-responsible inmates held in the jails during January 2005 – June 2015 were updated in June 2015. Source: Virginia Department of Corrections (August 24, 2015) 29
New commitments to prison peaked in FY2007 then declined through FY2012. New commitments grew by 1.9% and 5.9% in FY2013 and FY2014, respectively. State-Responsible Commitments, FY2005 – FY2014 The number of females committed to DOC in FY2014 (1,723, up 14% from FY2013) was an all time high for the Department. Change: Source: Virginia Department of Corrections – VA CORIS System (July 30, 2015) 30
Females are more likely than males to be committed to prison for nonviolent offenses, while males are more likely than females to be committed for violent offenses. New Commitments by Gender and Current Offense Type, FY2014 Property/Public Order Violent Drug Property/Public Order Violent Drug Note: Offense type represents the current offense for which the offender is being sent to prison. The Department of Corrections classifies burglary as a property offense. Source: Virginia Department of Corrections – VA CORIS System (July 30, 2015) 31
Female State-Responsible New Commitments, FY2012 - FY2014 * Includes Sex Offender Registry violations and obscenity Source: Virginia Department of Corrections – Female State-Responsible Offender Population Trends FY2010 – FY2014
MALE Group A Arrests Avg. Annual Change 2006 to 2011: +2.2% Avg. Annual Change 2012 to 2014: -3.1% During 2006 – 2011, female Group A arrests grew at more than twice the pace of male Group A arrests. Group A arrests have declined since 2011, but the decrease for males has been greater than for females. 2014 2006 2011 FEMALE Group A Arrests Avg. Annual Change 2006 to 2011: +5.6% Avg. Annual Change 2012 to 2014: -1.5% 2014 2006 2011 Source: Virginia State Police Incident-Based Crime Reporting Repository System as analyzed by the Dept. of Criminal Justice Services Research Center (September 1, 2015)
Since FY2010, the percentage of felony sentencing events resulting in a prison term has gradually increased for female offenders but remained relatively stable for male offenders. Felony Sentencing Events Resulting in a Prison Term By Gender, FY2010 – FY2014 Source: Virginia Criminal Sentencing Commission (September 2, 2015) 34
Since peaking at 52% in FY2006, probation violators have declined to 47%-48% of total commitments. Probation Violators Entering as New Commitments * Probation Violator information for FY2013-FY2014 is considered preliminary. Source: Virginia Department of Corrections – VA CORIS System (July 30, 2015) 35
Total time served by violent offenders gradually increased from FY2006 to FY2011 but has since returned to FY2008 levels; time served by property and drug offenders has been stable. Source: Virginia Department of Corrections – VA CORIS System (July 30, 2015)