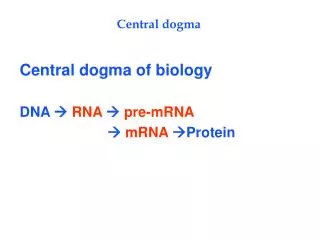
Download
1 / 77
770 likes | 1.07k Vues
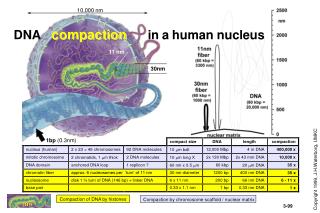
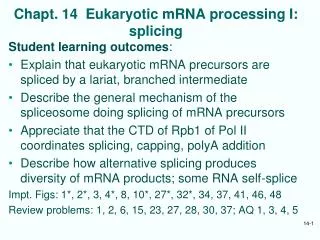
Chapter 14 Post transcriptional events I: Splicing. Micrograph of human pre-mRNA splicing factor in a cell nucleus. Table of contents. Genes in Pieces The Mechanism of Splicing of Nuclear mRNA Precursors Self-Splicing Introns tRNA Splicing. 14.1 Genes in pieces. Evidence for split genes;

E N D
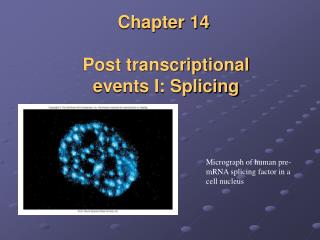
Chapter 14Post transcriptionalevents I: Splicing Micrograph of human pre-mRNA splicing factor in a cell nucleus
Table of contents • Genes in Pieces • The Mechanism of Splicing of Nuclear mRNA Precursors • Self-Splicing Introns • tRNA Splicing
14.1 Genes in pieces • Evidence for split genes; • RNA splicing; • Splicing signals
R-looping technique 14.1.1 Evidence for split genes • RNA products hybridize to DNA templates; • Electron microscopy exams;
R-looping experiments reveal introns in adenovirus Figure 14.1 R-looping experiments reveal introns In adenovirus. (a) Electron micrograph of a cloned fragment of edenovirus DNA containing the 5'-part of the late hexon gene, hybridized to mature hexon mRNA. The loops represent introns in the gene that cannot hybridize to mRNA. (b) Interpretation of the electron micrograph, showing the three intron loops (labeled A, B. and C), the hybrid (heavy red line), and the unhybridized region of DNA upstream from the gene (upper left), The fork at the lower right is due to the 3'-end o1 the mRNA, which cannot hybridize because the 3'-end of the gene is nct included. Therefore, the mRNA forms intramolecular double-stranded structures that have a forked appearance. (c) Linear arrangements of the hexon gene. showing the three short leader exons, the two introns separating them (A and B), and the long intron (C) separating the leaders from the coding exon of the hexon gene. All exons are represented by red boxes
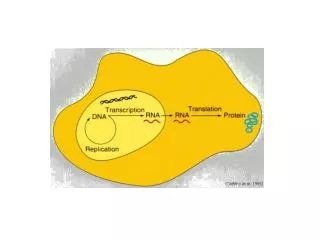
14.1.2 RNA splicing • mRNA synthesis in eukaryotes occurs I stages: • Synthesis primary transcription products; • mRNA maturation. • The removal of introns in a process is called splicing
Outline of splicing Figure 14.2 Outline of splicing. The introns in a gene are transcribed along with the exons (colored boxes) in the primary transcript. Then they are removed as the exons are spliced together
Introns are transcribed Figure 14.3 Introns are transcribed. (a) R-looping experiment in which mouse globin mRNA precursor was hybridized to a cloned mouse β-globin gene. A smooth hybrid formed, demonstrating that the introns are represented in the mRNA precursor. (b) Similar R-looping experiment in which mature mouse globin mRNA was used. Here, the large intron in the gene looped out, showing that this intron was no longer present in the mRNA. The small intron was not detected in this experiment. In the interpretive drawings, the dotted black lines represent RNA and the solid red lines represent DNA
14.1.3 Splicing signals Exon/GU-intron-AG/exon Yeast: 5’-AG/GUAAGU-intron-YNCURAC-YNNAG/G-3’ Mammals: 5’-/GUAUGU-intron_UACUAAC-YAG/-3’
14.2 Mechanism of splicing of nuclear mRNA precursors • A branched intermediate; • A signal at the branch • Splicesomes • Splicosome assembly
Simplified mechanism of nuclear mRNA precursor splicing Figure 14.4 Simplified mechanism of nuclear mRNA precursor splicing, in step 1, the 2' hydroxyl group of an adenine nucleotide within the intron attacks the phosphodiester bond linking the first exon (blue) to the intron. This attack, indicated by the dotted arrow at top, breaks the bond between exon 1 and intron, yielding the free exon 1 and the lariat-shaped intron-exon 2 intermediate, with the GU at the 5'-end of the intron linked through a phosphodiester bond to the branch-point A. The lariat is a consequence of the internal attack of one part of the RNA precursor on another part of the same molecule. At right in parentheses is the branch-point showing that the adenine nucleotide is involved in phosophdiester bonds through its 2’, 3’, and 5' hydroxyl groups. In step 2, the free 3' hydroxyl group on exon 1 attacks the phosphodiester bond between the intron and exon 2. This yields the spliced exon 1 -exon 2 product and the lariat-shaped intron. Note that the phosphate (red) at the 5'-end of exon 2 becomes the phosphate linking the two exons in the spliced product.
Anomalous electrophoretic behavior of spliced-out intron Figure 14.5 Anomalous electrophoretic behavior of spliced-out intron. (a) Splicing substrate. Sharp and colleagues started with a cloned fragment from the adenovirus major late region containing leader exons 1 (blue) and 2 (yellow), all of intron 1 and part of intron 2, They made a deletion in intron 1, yielding a shortened intron only 231 bp long. Finally, they transcribed this construct in vitro to produce a labeled splicing substrate.
(b) Electrophoresis. Sharp, and colleagues incubated the labeled splicing substrata from panel (a) with HeLa nuclear extract, then electrophoresed the resulting RNAs on (b), a 4%, or (c) a 10% polyacrylamide gel. Lane 1 and lanes 3-5 contained ATP: lane 2 did not. Lane 3 contained 2 μL of control serum; lanes 4 and 5 contained 1 and 2 μL , respectively, of an antiserum directed against an RNA-protein component required for splicing (see page 424, on snurps). Under splicing conditions (lanes 1.3. and 4), a band cot responding to the liberated intron was observed below the precursor bend in the 4% gel. but above the precursor band in the 10% gel.
Time course of intermediate and liberated intron appearance Figure 14.6 Time course of intermediate and llberated intron appearance. (a) Electrophoresis. Sharp and colleagues carried out splicing reactions as described in Figure 14.5 and electrophoresed Ihe products after various limes, indicated at top, on a 10% polyacrylamide gel. The products are identified at left. The top band contained the intron-exon 2 intermediate. The next band contained the intron. Both these RNAs were lariat-shaped, as suggested by their anomalously low electrophoretic mobilities. The next band contained the precursor. The botlom two bands contained two forms of the spliced exons: Ihe upper one was still attached to the piece of intron 2. and the lower one seemed to lack Ihat extra RNA. (b) Graphic presentation. Sharp and colleagues plotted the intensities of each band from panel (a) to show the accumulation of each RNA species as a function of time.
Mechanism of RNase T1 Figure 14.7 Mechanism of RNase T1. RNase T1 cuts RNA as follows: (a) The RNase cleaves the bond between the phosphate attached to the 3‘ hydroxyl of a guanine nucleotide and the 5' hydroxyl of the next nucleotide, generating a cyclic 2', 3'-phosphate intermediate. (b) The cyclic intermediate opens up, yielding an oligonucleotide ending in a guanosine 3'-phosphate.
Nearest neighbor analysis Figure 14.8 Strategy of an experiment to trace the origin of the phosphate between the two exons in a spliced transcript. (a) Nearest-neighbor analysis. This lechnique is not the one Sharp and colleagues used, but it embodies the same principle. First, we label RNA by synthesizing it in the presence of an α-32P-labeled nucleotide. CTP in this case, The lathed phosphate (red) is incorporated between the C and its nearest neighbor on the 5’ side, a U in this case. Next. we hydrolyze the labeled RNA with alkali, which cleaves on thin 3' cite of every base, yielding mononucleotides. Notice that this transfers the labeled phosphate to the nearest neighbor on the 5' side, so the uracil nucleotide is now labeled instead of the cytosine nucleotide. Finally. we separate all lout nucleotides and determine the radioactivity in each. This tells us how frequently each nucleotide is C's nearest Neighbor on the 5' side.
(b)Identifying the origin of the phosphate between spliced exons. Step 1: Sharp and his cilleagues labeled the splicing precursor with [α-32P] CTP, which labels the phosphate (red) between the intron and the second exon. Step 2: Our hypothesis of splicing places the labeled phosphate in the bond between the two spliced exons. The alternative scheme would involve the phosphate originally attached to the end of the first exon (blue in step 1), which would not be labeled because it entered the RNA on a GTP (the first G in the intron). Step 3: Next, Sharp and coworkers cleaved the spliced RNA with RNase A, which cuts after the pyrimidine C, yielding the oligonucleotide GpGpGpCp, where the phosphate between the last G and the C is labeled (red). Finally, they cleaved this oligonucleotide with alkali, cutting it into individual nucleotides. They analyzed these nucleotides for radioactivity and found that GMP was labeled. This indicated that the labeled phosphate at the end of the intron really did form the bridge between splice exons in the final RNA.
Direct evidence for a branched nucleotide Figure 14,9 Direct evidence for a branched nucleotide. (a) Sharp and colleagues digested the splicing intermediate with RNase T2. This yielded a product with a charge of -6, This is consistent with the branched structure pictured here. (b) Digestion with RNase P1 gave a product with a charge of -,4, consistent with this branched structure (c) Sharp and colleagues treated the P1 product with periodate and aniline to eliminate the nucleosides bound to the 2' and 3' phosphates of the branched nucleotide. The resulting product co-purified with adenosine 2', 3', 5'-trisphosphate, verifying the presence of a branch and demonstrating that the branch occurs at an adenine nucleotide. (c)
Demonstration the the 5’-end of the intro is involved in the branch
14.2.2 A signal at the branch Figure 14.11 Demonstration of a critical signal within a yeast intron.
Splicing takes place on a particle called a spliceosome. Yeast spliceosomes and mammalian spliceosomes have sedimentation coefficients of about 40S, and about 60S, respectively.
14.2.3 Spliceosomes Red: wild type Blue: mutant Figure 14.12 Yeast spliceosomes.
Snurps (small nuclear RNAs, snRNAs) Figure 14.14 Splicing scheme of adenovirus E1A gene and RNase protection assay to detect each spliced product.
(a) (b) Figure 14.15 Alignment of wild-type and mutant 5’ splice site with wild-type and mutant U1 snRNAs
Results of RNase protection assay Figure 14.16 Results of RNase protection essay. Zhuang and Weiner tested the wild-type and mutant 5' splice sites and wild-type and mutant U1 snRNAs pictured in Figure 14.15 by transfecting HeLa cells with plasmids containing these genes, then detected splicing by RNase protection as illustrated in Figure 14.14. Lane 1, size markers, with lengths in base pairs indicated at left. Lane 2, mock-transfected cells (negative control). Lane 3, wild-type EIA gene with wild-type U1 snRNA. Signals were visible for the 13S and 12S products, but not for the 9S product, which normally does not appear until lane in infection. Lane 4, mutant hr440 with an altered 12S 5' splice site. No 12S signal was apparent. Lane 5, mutant hr440 plus mutant U1 snRNA (U1-4u). Splicing at the 12S 5' site was restored. Lane 6, mutant pm1114 with an altered 13S 5' splice site. No 13S signal was apparent. Lane 7, mutant pm1 114 plus mutant U1 snRNA (U1-6a)o Even though base pairing between 5‘ splice site and U1 snRNA was restored, no 13S splicing occurred.
Figure 14.17 Two models for interaction between a yeast 5’ splice site and U6 snRNA.
(a) (b) (c) Figure 14.18 Reporter genes used to detect normal and aberrant splicing.
(a) (b) Figure 14.19 Test of model 1 base-paring.
(a) (b) (c) Figure 14.20 Summary of a test of model II base-paring.
Crosslinking of splicing intermediates with 4-thioU Figure 14.21 Crosslinking of splicing intermediates with 4-thioU. Sontheimer and Steitz incubated a labeled adenovirus splicing precursor containing 4-thioU in the second position of the intron with a nuclear splicing extract. After various periods of time (indicated at top), they removed samples, uv-irradiated them to cross-link the 4-thioU to any RNAs in the neighborhood, and electrophoresed the products. Lane 1, input RNA with no incubation; lane 2, 20-minute incubation with no nuclear extract (NE); lane 3, 20 minute incubation followed by no uv-irradiation; lanes 4-12, incubation for the times indicated at top; lane 13, no 4-thioU labeling; lane 14, no ATP; lane 15, EDTA added to chelate magnesium and block splicing; lane 16, a fraction clarified by high-speed ultracentrifugation was used instead of nuclear extract. The dot at left denotes a band resulting from an intramolecular cross-link.
Figure 14.22 Two-dimensional electrophoresls to detect splicing complexes.
Figure 14.22 Two-dimensional electrophoresls to detect splicing complexes. (a) Complexes involving U 1, U2, U4, and U5. Wassarman and Steitz formed splicing complexes using a biotin-labeled splicing precursor, cross-linked RNAs in the complexes with psoralen, and isolated snRNP-containing complexes by first precipitating with an anti-m3G antibody (which recognizes all snRNPs except U6). then precipitating with streptavidin beads, which recognize the splicing procurer. Next they end-labeled the RNAs in the complexes with [32P]pCp and RNA ligase, then electrophoresed these complexes in the horizontal dimension as shown at top right. They dissociated the complexes with ultraviolet light (254 nm) and electrophpresed the RNAs in the vertical dimension to identify each RNA in each complex. The marker positions at right identify the individual RNA species in each complex, and the mixtures of RNAs in the complexes are suggested at bottom. Sometimes. two or more complexes co-purified This was the case with U2/U4/U6, a U1 internally linked molecule, and the U2/lariat complex. (b) Complexes containing U6. Since U6 does not have a m3G cap, Wassarman and Steitz isolated complexes containing this snRNP using a biotin-labeled U6-specific oligonucleotide and avidin beads. Other conditions were as in panel (a). The marker positions at right identify both splicing substrate and lariat, as well as U2, as components of U6-containing complexes. U6 itseff is not detectable in the first two of these complexes, but we know it is there, since these complexes were selected by a U6-specific probe
Figure 14.23 Base paring between yeast U2 and yeast branch point sequence.
Figure 14.24 Growth of A257 (panel a) and A256 (penel b) mutants on Hol medium in the presence of wild-type and suppressor mutant U2. The abbreviations under each patch of cells denote the nature of the U2 added, if any: UT, untransformed (no U2 added); WT, wild-type U2; U36, U2 with mutation that restores base pairing with A257; U37, U2 with mutation that restores base pairing with A256; LP, a colony that lost its U2 plasmid, The positive control in each plate (+) contained a wild-typa fusion gene and no extra U2. The negative control in each plate contained no fusion gene.
Figure 14.25 Detection of a complex between U5 and the 5' end of the second exon.
Figure 14.25 Detection of a complex between U5 and the 5' end of the second exon. (a) Forming the complex. Sontheimer and Steitz placed 4-thioU in the first position of the second exon of a labeled splicing substrata and cross-linked in to whatever RNAs were nearby at various times during splicing. Then they electrophoresed the products and detected them by autoradiography. The US/intron-E2 doublet appears near the top late in the splicing process (after 30 minutes), Lane designations are as in Figure 14.21. (b) Identification of the RNAs in the complex. Sontheimer and Staitz irradiated the splicing mix after 30 minutes of splicing to form crosslinks, then incubated it with DNA oligonuclaotides complementary to U5 and other RNAs, then added RNase H to degrade any RNAs hybridized to the oligonucleotides. Finally, they electrophoresed and autoradiographed the products. The oligonucleotides (oligos) used were as follows: lanes 1 and 5, no oligo; lane 2, anti-exon 1 oligo; lane 3, anti-intron oligo; Lane 4, anti-exon 2 oligo; lane 6, anti-US oligo. The anti-intron, anti-exon 2, and anti-US oligos all destroyed the complex, indicating that the complex is composed of the intron, second exon, and US.
Figure 14.26 Identification of snRNP bases cross-linked to 4-thioU In various positions in the slicing substrate.
Figure 14.26 Identification of snRNP bases cross-linked to 4-thioU In various positions in the slicing substrate. Sontheimer and Steitz used primer extension to map the bases in U5 and U6 cross-linked to 4-thioU in the following positions: the last base in the first exert (Ad5-1, panels a and b); the second base in the intron (Ad5+2, panel c); or the first base in the second exert (Ada+l, panel d). They formed cross-linked complexes with these RNAS, then excised the complexes from the electrophoresis gels and added primers specific for either U5 or U6, and performed primer extension analysis. The first four lanes in panels (a-c) and lanes 5-8 in panel (d) are sequencing lanes using the same primer as in the primer extension assays The lanes marked "blank" are control sequencing lanes with no template. The experimental lanes are lanes 6 in panels (a and b), lanes 6 and 8 in panel (c), and lane 1 in panel (d). These are the results of primer extension with: the US/splicing precursor complex (US/pro, panel a); the U5/exon 1 complex (U5/E1, panel b); the U6/inntron-exon 2 complex (U6/intron-E2, panel c), and the U6/intron complex, panel (c); and the U5/intron-exon 2 complex (U5/intron-E2, panel d). The other lanes are controls as follows; "no substrate," substrate was omitted from the reaction mix, then a slice of gel was cut out from the position where complex would be if substrate wore included; "UV RNA," total RNA from an extract lacking substrate: "pre-mRNA," uncross-linked substrate. The c~ss-linked bases in the snRNPs are marked with dots at the Left of each panel.
Figure 14.27 Summary of U5 and U6 interactions with the splicing substrates revealed by 4-thioU crosslinking.
Figure 14.29 A model to compare the active center of a spliceosome to the active center of a group II intron.
14.2.5 Spliceosome assembly Figure 14.30 Kinetics of association of spliceosomal snRNPs with pre-mRNA.
Effect of inactivation of U1 or U2 on assembly of the spliceosome Figure 14.31 Effect of Inactivation of U1 or U2 on assembly of the spliceosome.
Figure 14.31 Effect of Inactivation of U1 or U2 on assembly of the spliceosome. Ruby and Abelson inactivated either U1 or U2 by incubation with RNase H and a DNA oligonucleotide complementary to a key part of either snRNA. Lanes 11-15 show the patterns of labeled snRNAs in an extract after treating with RNase H and: no oligonucleotide (No); an anti-U1 oligonucleotide (U1); an anti-U2 oligonucleotide (U2); or an anti-T7 oligonucleotide (1"7). The latter sewed as a second negative control. Treatment with RNase H and anti-U1 led to essentially complete conversion to a truncated form that electrophoresed slightly faster than the parent RNA. Treatment with RNase H and anti-U2 led to near-elimination of full-size U2, and appearance of a small amount of truncated U2. Lanes 1-10 show the results of spliceosome assembly experiments, as described in Figure 14.30, under the following conditions, as indicated at top: C303/305 pre-mRNA, or no prs-rnRNA; extracts treated with RNase H and no oltgonucleotide, anti-U1, anti-U2, or anti-T7 oligonucleotides; and with or without ATP. Inactivating U 1 prevented binding of U1, U2, and U5. Inactivating U2 prevented binding of U2 and U5.
Figure 14.29 Structure of U1 snRNP. Stark and colleagues used single-particle electron cryomicroscopy to obtain this stereo model of the snRNP structure. The major protrusions, including the U1-A and 70K proteins, from the central Sm "doughnut" are labeled.
Commitment of the human β-globin pre-mRNA Figure 14.33 Commitment of the human β-globin pre-mRNA.
Figure 14.33 Commitment of the human β-globin pre-mRNA. (a) Commitment competition assay with general splice site competitor RNAs. Xiang-Dong Fu used a competition assay for commitment as follows. He incubated a labeled human β-globin preomRNA with or without SC35, as indicated at top (+ and -, respectively). Then he added a nuclear extract with or without a competitor RNA, as indicated at top. No competitor is indicated by (-). C1 and C2 are non-specific RNAs that should not interfere with splicing, RNAs containing 5' and 3' splice sites are indicated as 5'SS and 3'SS, respectively. After allowing two hours for splicing, Fu electrephoresed the labeled RNAs and autoradiogrephed the gel. The positions of pre-mRNA and mature mRNA are indicated at right. SC35 caused commitment. (b) Commitment assay with specific competitor. Fu re-ran the competition assay with the human β-globin pre-mRNA as competitor. Again, SC35 caused commitment, especially if added before the competitor (prsincubation). (c) Conditions favoring commitment. Fu ran the commitment assay again under the conditions listed at top.