Neural Imaging II: Imaging Brain Function
Neural Imaging II: Imaging Brain Function. ANA 516: February 13, 2007 Jane E. Joseph, PhD. Outline. Physiological Basis of functional MRI (fMRI) Experimental Design and Data Analysis Issues Brief survey of fMRI studies in animals (mostly). What is fMRI?.

Neural Imaging II: Imaging Brain Function
E N D
Presentation Transcript
Neural Imaging II: Imaging Brain Function ANA 516: February 13, 2007 Jane E. Joseph, PhD
Outline Physiological Basis of functional MRI (fMRI) Experimental Design and Data Analysis Issues Brief survey of fMRI studies in animals (mostly)
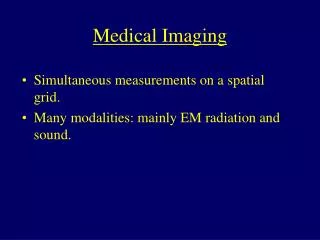
What is fMRI? • One of a number of brain imaging techniques that reveal some dynamic, in vivo aspect of brain function.
What is fMRI? Spatial resolution Temporal resolution
What is fMRI? • An INDIRECT measure of neural activity • Measures relative concentrations of de-oxygenated blood • Don’t need any contrast agents or radiation
Brief History of MRI / fMRI • 1890 -- Roy and Sherrington postulated that changes in activity associated with brain function would lead to increases in blood flow in those regions • 1945 – Bloch and Purcell share the Nobel prize for their work with magnetic resonance
Brief History of fMRI • 1990 – Ogawa, et al. showed that MR images could be used to detect changes in blood oxygenation in vivo (in mouse brain) • 1991 – First human fMRI studies
Non-invasive which makes it ideal for: • (1) developmental studies (kids can go in MRI scanner) • (2) longitudinal studies (kids / people can go in multiple times) • (3) aging studies • Widely available (c.f. PET, TMS) • No known health risks (c.f. PET) fMRI vs Other techniques
fMRI vs Other techniques • fMRI is NOT a good choice in certain situations: • Many surgical implants cannot go in MRI scanner • Presence of metal in body (or on body – tattoos, makeup) • To measure neurotransmitters (use spectroscopy or PET)
fMRI vs Other techniques • fMRI is NOT a good choice in certain situations: • Claustrophobia • To study gross motor behavior • Certain patient populations with movement disorders (e.g PD)
POSTERIOR Structural v. Functional MRI POSTERIOR
POSTERIOR What is the physiological process or event that contributes to contrast in a functional image?
Want to measure some aspect of neural activity, but fMRI does not do this directlyInstead, fMRI is based on changes in oxygen consumption and blood flow, which are indirectly related to neural activity
Excitatory post-synaptic potentials (EPSPs), Inhibitory post-synaptic potentials (IPSPs), and Action potentials (APs) are not very metabolically demandingBut the return to resting state does require energy!
How is blood flow related to neural activity?Increased neural activity causes release of vasoactive substances, which cause vessels (arterioles) to dilate – these effects can occur locally and upstream from the activity
How are these physiological changes measured with MRI?Deoxygenated hemoglobin (dHb) is paramagnetic (e.g. has unpaired electrons) due to losing O2 moleculesdHb disrupts the magnetic field locally (dephasing spins shorten T2*)
More dHb loss of MR signal Pure O2 (100%) 20% O2
de-oxygenated blood oxygenated blood
de-oxygenated blood oxygenated blood magnetic field gradient De-oxy hemoglobin disrupts magnetic field and causes a signal loss
de-oxygenated blood oxygenated blood magnetic field gradient Surplus of oxy hemogolobin relatively lower concentration of deoxy hemoglobin in active regions
de-oxygenated blood oxygenated blood magnetic field gradient Less decrement in signal (OR small increments in signal) at activated sites
Blood Oxygenation Level Dependent Contrast (BOLD):1. dHb is paramagnetic2. Surplus of oxygenated blood at sites of activation
Early fMRI studies (Belliveau, et al. 1991) Look at flashing checkerboard pattern Look at blank screen Subtract Image A from Image B This study not based on BOLD but used contrast !!!!
Blamire, et al. (1992) showed that the BOLD response is delayed relative to the neural events associated with stimulus presentation (hemodynamic lag) we are not measuring neural processes directly
BOLD response is related to neural activity (even though it is delayed)
POSTERIOR A typical hemodynamic response (HDR): y-axis: Usually express in % change from baseline
superior right left posterior inferior +z +y +x -x -z Talairach Atlas (Talairach & Tournoux, 1988) anterior -y Anterior commissure Posterior commissure
Brodmann’s Areas (Brodmann, 1909)Lateral Surface Primary Sensory: - Visual (17) - Auditory (41) - Motor (4) - Somatosensory (1,2,3) Secondary: - Visual (18) - Auditory (42) Association: - Visual (19, 37) - Auditory (22) - Somatosensory (5)
Brodmann’s Areas (Brodmann, 1909)Medial Surface Primary Sensory: - Olfactory (28, 38) Association: - Limbic (23, 24, 25, 26, 27, 29, 30, 31, 32, 33)
Experimental Design and Data Analysis Issues • Technique constraints • Limitations on experimental designs • Advantages of fMRI
Technique Constraints • BOLD signal ~= neuronal activity • Poor temporal resolution • No information about temporal order of events • Spatial resolution
Limitations on Experimental Design • No ferrous magnetic materials in scanner • Use tasks that minimize amount of movement (gross motor tasks, speaking?) • Auditory stimulus presentation may be masked by scanner noise • Limits on length of experiments (hardware limitations and subject comfort) • Subtraction Technique
Limitations on Experimental Design • Subtraction Technique: • Must have a baseline condition with which to compare an experimental condition • May also have a control condition (or several) • What is a good baseline condition?
Advantages of fMRI • Can do repeated measures learning, practice, intervention, recovery of function • Can test pediatric populations developmental, longitudinal and aging studies • Can look at individual-subject activation patterns
Some applications • Imaging brain function in animals
Zhang et al. (2006). NeuroImage, 33, 636-643 Pharmacological MRI (phMRI) in MPTP lesioned rhesus monkeys
Joseph et al. (2006). Journal of Neuroscience Methods, 157, 10-24 Functional MRI (fMRI) in alert, unanesthetized rhesus monkeys
Both monkeys showed novelty detection effects in the amygdala (only 1 monkey shown here)
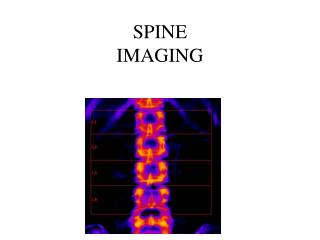
BOLD imaging of spinal cord in rats Hindlimb electrical stimulation dorsal column activity on the ipsilateral side Lilja et al. (2006). The Journal of Neuroscience, 26, 6330-6336
BOLD imaging of spinal cord in humans Stimulate different fingers dorsal column activity in different dermatomes Stracke et al. (2005). Neuroradiology, 47, 127-143