Statistics (1) Fall 2009
Statistics (1) Fall 2009. Lecture One (Chapter One) What is Statistics?. What is Statistics?.

Statistics (1) Fall 2009
E N D
Presentation Transcript
Statistics (1) Fall 2009 Lecture One (Chapter One) What is Statistics?
What is Statistics? A poll solicits a large number of college undergraduates for information on the following variables: the name of their cell phone provider, the number of minutes used last month, and their satisfaction with the service. What is the data scale for each of these three variables?
GOALS of this lecture • Understand why we study statistics. • Explain what is meant by descriptive statisticsand inferential statistics. • Distinguish between a qualitative variable and a quantitative variable. • Describe how a discrete variable is different from a continuous variable. • Distinguish among the nominal, ordinal, interval, and ratio levels of measurement.
What is Meant by Statistics? Statisticsis the science of collecting, organizing, presenting, analyzing, and interpreting numerical data to assist in making more effective decisions.
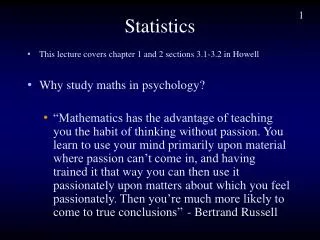
Why Study Statistics? • Numerical information is everywhere. • Statistical techniques are used to make decisions that affect our daily lives. • The knowledge of statistical methods will help you understand how decisions are made and give you a better understanding of how they affect you. No matter what line of work you select, you will find yourself faced with decisions where an understanding of data analysis is helpful.
What is Meant by Statistics? • In the more common usage, statistics refers to numerical information Examples: the average starting salary of college graduates, the number of deaths due to alcoholism last year, the change in the Dow Jones Industrial Average from yesterday to today, and the number of home runs hit by the Chicago Cubs during the 2007 season. • We often present statistical information in a graphical form for capturing reader attention and to portray a large amount of information.
Formal Definition of Statistics Some examples of the need for data collection. • Research analysts for Merrill Lynch evaluate many facets of a particular stock before making a “buy” or “sell” recommendation. • The marketing department at Colgate-Palmolive Co., a manufacturer of soap products, has the responsibility of making recommendations regarding the potential profitability of a newly developed group of face soaps having fruit smells. • The United States government is concerned with the present condition of our economy and with predicting future economic trends. • Managers must make decisions about the quality of their product or service. STATISTICS The science of collecting, organizing, presenting, analyzing, and interpreting data to assist in making more effective decisions.
Who Uses Statistics? Statistical techniques are used extensively by marketing, accounting, quality control, consumers, professional sports people, hospital administrators, educators, politicians, physicians, etc...
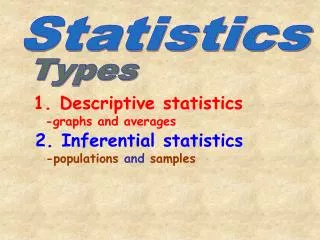
Types of Statistics – Descriptive Statistics and Inferential Statistics Descriptive Statistics - methods of organizing, summarizing, and presenting data in an informative way. EXAMPLE 1: The United States government reports the population of the United States was 179,323,000 in 1960; 203,302,000 in 1970; 226,542,000 in 1980; 248,709,000 in 1990, and 265,000,000 in 2000. EXAMPLE 2: According to the Bureau of Labor Statistics, the average hourly earnings of production workers was $17.90 for April 2008.
Types of Statistics – Descriptive Statistics and Inferential Statistics Inferential Statistics: A decision, estimate, prediction, or generalization about a population, based on a sample. Note: In statistics the word population and sample have a broader meaning. A population or sample may consist of individuals or objects
A populationis a collection of all possible individuals, objects, or measurements of interest. A sample is a portion, or part, of the population of interest Population versus Sample
Why take a sample instead of studying every member of the population? • Prohibitive cost of census • Destruction of item being studied may be required • Not possible to test or inspect all members of a population being studied
Usefulness of a Sample in Learning about a Population Using a sample to learn something about a population is done extensively in business, agriculture, politics, and government. EXAMPLE: Television networks constantly monitor the popularity of their programs by hiring Nielsen and other organizations to sample the preferences of TV viewers.
Types of Variables A.Qualitative or Attribute variable - the characteristic being studied is nonnumeric. EXAMPLES: Gender, religious affiliation, type of automobile owned, state of birth, eye color are examples. B.Quantitative variable - information is reported numerically. EXAMPLES: balance in your checking account, minutes remaining in class, or number of children in a family.
Quantitative Variables - Classifications Quantitative variables can be classified as either discrete or continuous. A. Discrete variables: can only assume certain values and there are usually “gaps” between values. EXAMPLE: the number of bedrooms in a house, or the number of hammers sold at the local Home Depot (1,2,3,…,etc). B. Continuous variable can assume any value within a specified range. EXAMPLE: The pressure in a tire, the weight of a pork chop, or the height of students in a class.
Nominal level - data that is classified into categories and cannot be arranged in any particular order. EXAMPLES: eye color, gender, religious affiliation. Ordinal level – data arranged in some order, but the differences between data values cannot be determined or are meaningless. EXAMPLE: During a taste test of 4 soft drinks, Mellow Yellow was ranked number 1, Sprite number 2, Seven-up number 3, and Orange Crush number 4. Interval level - similar to the ordinal level, with the additional property that meaningful amounts of differences between data values can be determined. There is no natural zero point. EXAMPLE: Temperature on the Fahrenheit scale. Ratio level - the interval level with an inherent zero starting point. Differences and ratios are meaningful for this level of measurement. EXAMPLES:Monthly income of surgeons, or distance traveled by manufacturer’s representatives per month. Four Levels of Measurement
Nominal-Level Data Properties: • Observations of a qualitative variable can only be classified and counted. • There is no particular order to the labels.
Ordinal-Level Data Properties: • Data classifications are represented by sets of labels or names (high, medium, low) that have relative values. • Because of the relative values, the data classified can be ranked or ordered.
Interval-Level Data Properties: • Data classifications are ordered according to the amount of the characteristic they possess. • Equal differences in the characteristic are represented by equal differences in the measurements. Example: Women’s dress sizes listed on the table.
Ratio-Level Data • Practically all quantitative data is recorded on the ratio level of measurement. • Ratio level is the “highest” level of measurement. Properties: • Data classifications are ordered according to the amount of the characteristics they possess. • Equal differences in the characteristic are represented by equal differences in the numbers assigned to the classifications. • The zero point is the absence of the characteristic and the ratio between two numbers is meaningful.
Why Know the Level of Measurement of a Data? • The level of measurement of the data dictates the calculations that can be done to summarize and present the data. • To determine the statistical tests that should be performed on the data
Homework for Chapter One • Exercises 2, 4, 8, 10, and 13