Download

1 / 42
420 likes | 621 Vues
Statistics Review - 1. What is the difference between a variable and a constant? Why are we more interested in variables than constants? What are the four levels of measurement?. Statistics Review - 2. What is the difference between a measure of central tendency and a measure of dispersion?

E N D
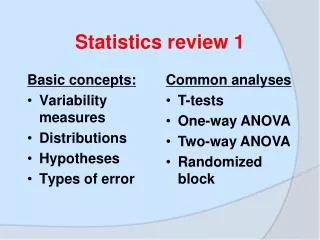
Statistics Review - 1 What is the difference between a variable and a constant? Why are we more interested in variables than constants? What are the four levels of measurement?
Statistics Review - 2 What is the difference between a measure of central tendency and a measure of dispersion? What are the three measures of central tendency and under what circumstances do we use each one? What must we have in order to have a “social science model”? Why do we typically use regression rather than measures of association?
Distributions (Normal & T) What is the purpose of a Z score? What is the utility of Tchebysheff’s Theorem? What use of the normal curve did we make in significance testing? What are the two principles of any test of statistical significance?
Statistics Review - 3 Variable | Obs Mean Std. Dev. Min Max -------------+-------------------------------------------------------- tax | 100 46.54 28.731 7 97 cons | 100 35.11 31.242 0 100 party | 100 .62 .487 0 1 stinc | 100 9.20 1.524 6.1 12.4 WHAT CONCLUSIONS DO YOU DRAW ABOUT THE DISPERSION OF SCORES ON EACH OF THESE VARIABLES?
Recoding Tax and Conservatism In the following exercise “Tax” and “Conservatism” are recoded as follows: 0 – 33 = 1 34-66 = 2 67-100 = 3 Note: this procedure “costs” us much information (i.e., 34 is the same as 66)
Cross Tabulation of Tax and Conservatism Tax Conservatism 1 2 3 1 12.3% 76.2% 95.5% 2 40.4% 23.8% 4.5% 3 47.3% 0.0% 0.0% What does the above data tell us?
Measures of Association Association between Tax and Conservatism Pearson’s Correlation: -.69 Gamma: -.94 Kendall’s tau-b: -.67 NOTE: if percentages rather than 1-3 scale are used Pearson’s Correlation is -.80. Not using all the information reduces the association. WHAT DOESN’T THE ABOVE ANALYSIS TELL US THAT WE USUALLY WANT TO KNOW?
Regression Review – 2- Regression of Tax on Cons, Party and Stinc in Stata Source | SS df MS Number of obs = 100 -------------+------------------------------ F( 3, 96) = 65.44 Model | 54886.5757 3 18295.5252 Prob > F = 0.0000 Residual | 26840.2643 96 279.586087 R-squared = 0.6716 -------------+------------------------------ Adj R-squared = 0.6613 Total | 81726.84 99 825.523636 Root MSE = 16.721 ------------------------------------------------------------------------------ tax | Coef. Std. Err. t P>|t| Beta -------------+---------------------------------------------------------------- cons | -.64472 .07560 -8.53 0.000 -.7010575 party | 11.20792 4.67533 2.40 0.018 .1902963 stinc | -.56008 1.28316 -0.44 0.663 -.0297112 _cons | 67.38277 15.11393 4.46 0.000 . ------------------------------------------------------------------------------ Interpret both the unstandardized (“Coef.” column) and standardized (“Beta” column). Karl Marx’s thoughts on this?
Regression Review - 3 We might think of the value of “y” (percentage of times the senator supports the poor/middle income groups on tax legislation) we observe is conditional on the value of “x” (e.g., the senator’s conservatism). Take the mean of y at each value of x We essentially have a frequency distribution for the values y can take on for each value of x
E(Y | xi) The one time we observe x, it is likely to be close to the mean of its probability distribution
Why Multiple Regression? Example from the 300Reader: Value of “b”: (1) if you use the senator’s conservatism to explain tax voting: -.737 (2) if you use the senator’s party to explain tax voting: 35.293 (3) if you use the median family income in the senator’s state to explain tax voting: 2.867 CAN YOU INTERPRET EACH “b”?
Why Multiple Regression? Source | SS df MS Number of obs = 100 -------------+------------------------------ F( 3, 96) = 65.44 Model | 54886.5757 3 18295.5252 Prob > F = 0.0000 Residual | 26840.2643 96 279.586087 R-squared = 0.6716 -------------+------------------------------ Adj R-squared = 0.6613 Total | 81726.84 99 825.523636 Root MSE = 16.721 ------------------------------------------------------------------------------ tax | Coef. Std. Err. t P>|t| Beta -------------+---------------------------------------------------------------- cons | -.64472 .07560 -8.53 0.000 -.7010575 party | 11.20792 4.67533 2.40 0.018 .1902963 stinc | -.56008 1.28316 -0.44 0.663 -.0297112 _cons | 67.38277 15.11393 4.46 0.000 . ------------------------------------------------------------------------------ Interpret both the unstandardized (“Coef.” column) and standardized (“Beta” column). Karl Marx’s thoughts on this?
Multiple Regression - Interpretation Notice how much smaller the impact of senator party identification is when senator ideology is in the same equation. Also, note that the sign (i.e., direction of the relationship) for state median family income changes from positive to negative once all three independent variables are in the same equation.
Multiple Regression – Prediction - 1 From the previous output we know the following: “a” = 67.382, the impact of senator conservatism = -.644, the impact of senator party affiliation = 11.207 and the impact of the median household income in the senator’s state = -.560. Senator #1’s scores on the three independent variables are as follows: conservatism = 26, party affiliation = 1 and state median household income = 7.4 (i.e., $7,400 in 1970).
Multiple Regression – Prediction - 2 To predict the score on “tax” for senator #1 the computer works the following equation: 67.382 + (26)(-.644) + (1)(11.207) + [(7.4)(-.560)] = 67.382 – 16.744 + 11.207 – 4.144 = 57.701
Multiple Regression – Prediction - 3 Senator #1 is “predicted” to support the poor 57.701% of the time . Since senator #1 “actually” supported the poor on 54% of their tax votes, the prediction error (“e” or “residual”) for senator #1 is: 54 - 57.701 = -3.701 The computer then squares this value (i.e., -3.701 x -3.701 = 13.69). The computer performs this same operation for all 100 senators. The sum of the squared prediction errors for all 100 senators is 26,840.
Multiple Regression – Prediction - 4 If any of the values of the coefficients (i.e., 67.382, -.644, 11.207 or -.560) were changed, the sum of the squared prediction errors would have been greater than 26,840. This is known as the “least squared errors principle.”
Regression Model Performance - 1 Let’s see how well our regression model performed. From the following we know that the mean score on “tax” is 46.5 (i.e., the average senator supported the poor/middle class 46.5% of the time). Variable | Obs Mean Std. Dev. -------------+---------------------------------------------- tax | 100 46.54 28.73193
Regression Model Performance - 2 We also know that senator #1 supported the poor/middle class 54% of the time. If we subtract the average score from senator #1s score, we obtain senator #1s deviation from the mean. Thus, 54 – 46.54 = 7.46. If we squared this deviation (i.e., 7.46 x 7.46) we obtain the squared deviation from the mean for senator #1 (7.46 x 7.46 = 55.65).
Regression Model Performance - 3 If we repeat this process for all remaining 99 senators and add this total, we obtain the total variation in the dependent variable that we could explain: 81,776. From the previous discussion we know that the total squared prediction errors equal 26,840. If take [1 – (26,840/81,776 = 1 - .328 = 67.1) we find that variation in senator conservatism, party affiliation and state median household income explained 67.1% of the variation in senatorial voting on tax legislation.
Review of Nonlinear Models What are nonlinear models? Under what circumstances should we use probit/logit instead of regression?
Multicollinearity An independent variable may be statistically insignificant because it is highly correlated with one, or more, of the other independent variables. For example, perhaps state median family income is highly correlated with senator conservatism (e.g., if wealthier states elected more conservative senators). Multicollinearity is a lack of information rather than a lack of data.
Multicollinearity Check in Stata 1 - 1/vif yields the percentage of the variation in one independent explained by all the other independent variables. Variable | VIF 1/VIF -------------+---------------------- cons | 1.98 0.506218 party | 1.84 0.542894 stinc | 1.35 0.738325 What would Karl Marx think now?
Multicollinearity - Interpretation Unfortunately for Karl Marx, only 26% of the variation in state median family income is explained by the variation in senator conservatism and senator party affiliation (1- .738 = .262). Since this is low (i.e., well below the .70 threshold mentioned in the readings), Marx can’t legitimately claim high multicollinearity undermined his hypothesis.
Bread and Peace Model - 1 The Bread and Peace Model explain presidential voting on the basis of the percentage change in real disposable income and U.S. casualties in post-WWII wars. a = 46.2 (y intercept) b1 = 3.6 (average per capita real income growth – annual lag operator .91) b2 = -.052 (thousands of post-WWII casualties)
Government Benefits - 1 The following slide contains the percentage of people who (a) benefit from various programs, and (b) claim in response to a government survey that they 'have not used a government social program.’ Government social programs are stigmatized as “welfare.” But many people benefit from such programs without realizing it. This results in a likely underprovision of such benefits.
Government Benefits - 2 529 or Coverdell - 64.3 Home mortgage interest deduction - 60.0 Hope or Lifetime Learning Tax Credit- 59.6 Student Loans - 53.3 Child and Dependent Tax Credit - 51.7 Earned income tax credit - 47.1 Pell Grants – 43.1 Medicare – 39.8 Food Stamps – 25.4
Regression in Value Added Teacher Evaluations – LA Times - 3/28/11 The general formula for the "linear mixed model" used in her district is a string of symbols and letters more than 80 characters long: y = Xβ + Zv + ε where β is a p-by-1 vector of fixed effects; X is an n-by-p matrix; v is a q-by-1 vector of random effects; Z is an n-by-q matrix; E(v) = 0, Var(v) = G; E(ε) = 0, Var(ε) = R; Cov(v,ε) = 0. V = Var(y) = Var(y - Xβ) = Var(Zv + ε) = ZGZT + R. In essence, value-added analysis involves looking at each student's past test scores to predict future scores. The difference between the prediction and students' actual scores each year is the estimated "value" that the teacher added — or subtracted.
California Election 2010 - 1 correlate boxer10 brown10 coll00 medinc08 (obs=58) | boxer10 brown10 coll00 medinc08 -------------+------------------------------------ boxer10 | 1.0000 brown10 | 0.9788 1.0000 coll00 | 0.7422 0.6885 1.0000 medinc08 | 0.6022 0.5401 0.8321 1.0000