Area Under the Curve
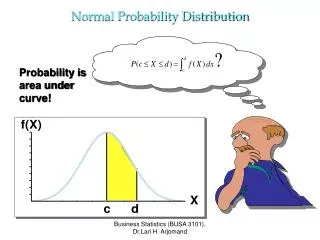
Area Under the Curve. Probability. Area Under a Normal Curve. The z score that corresponds to a data value represents a Normal Percentile . These percentiles can be found on the table on pages A-29 and 30 in the back of your book.


Area Under the Curve
E N D
Presentation Transcript
Area Under the Curve Probability
Area Under a Normal Curve • The z score that corresponds to a data value represents a Normal Percentile. • These percentiles can be found on the table on pages A-29 and 30 in the back of your book. • These percentiles represent the probability of being at that z score or lower. Cumulative area from the left.
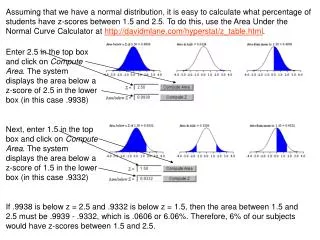
Area Under a Normal Curve • Determine the area under the normal curve to the left of z=1.00 • Determine the area under the normal curve between z=-1.5 and z=1.0 • pg 876-880 #3, 4, 6, 8
Percentiles • Male heights are distributed with a mean of 69 inches and a standard deviation of 2.5 inches. • Female heights are normally distributed with a mean of 64.5 inches and a standard deviation of 2.5 inches.
Practice • pgs 890-892 #4-12
Percentiles • Label the graph for you, find your z-score and percentile!
Percentiles • The blood pressure of an 18 year old woman is normally distributed with mean of 120 and a standard deviation of 12. Draw and label the Normal Model for this data.
Percentiles • What percent of 18 year old women have a blood pressure between 96 and 144? • Greater than 120? • Less than 96?
Percentiles • The normal car speeds on an old town highway have a mean of 77 and a standard deviation of 9.1. What is the value of the 85th percentile? • Step 1: Look up the closest to .85 (%) on the z-table. • Step 2: Find the corresponding z-score. • Step 3: Set up an equation with the z-score, mean, and standard deviation. • Step 4: Solve for x.