Download
1 / 1
10 likes | 172 Vues
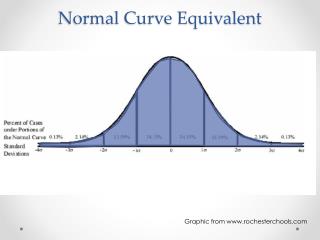
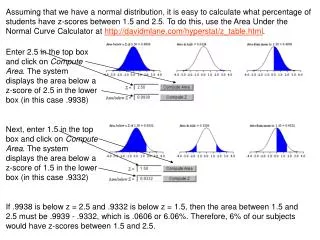
Easily determine the percentage of students with z-scores between 1.5 and 2.5 using the Area Under the Normal Curve Calculator.

E N D
Assuming that we have a normal distribution, it is easy to calculate what percentage of students have z-scores between 1.5 and 2.5. To do this, use the Area Under the Normal Curve Calculator at http://davidmlane.com/hyperstat/z_table.html. Enter 2.5 in the top box and click on Compute Area. The system displays the area below a z-score of 2.5 in the lower box (in this case .9938) Next, enter 1.5 in the top box and click on Compute Area. The system displays the area below a z-score of 1.5 in the lower box (in this case .9332) If .9938 is below z = 2.5 and .9332 is below z = 1.5, then the area between 1.5 and 2.5 must be .9939 - .9332, which is .0606 or 6.06%. Therefore, 6% of our subjects would have z-scores between 1.5 and 2.5.